Hickson is the poster child for the usage-efficiency tradeoff. 2010: 58% TS, 18.9% USG; 2011: 50.3% TS, 25.5% USG.
2012 predictions
Re: 2012 predictions
It's funny you mentioned "poster child" and Hickson. Here's a tweet I made yesterday:
Re: 2012 predictions
The Jazz were 31-33 with Kirilenko and 8-10 without him. And I'm not making any point with this.Good catch. Four of those wins came with Kirilenko in the lineup thoughThe Jazz were 7-9 with Devin Harris
The Cavs were a lost team last year. After losing both Varejao and Jamison, Hickson was their default go-to big guy. He raised his shots/min by 35% and saw his TS% plunge from .580 to .503 . Any reason to suppose he won't shoot better if he doesn't have to take so many shots with the Kings?
He led the team in minutes, points, rebounds, and blocks.
His Reb% (17.7) was by far the team's best (w Varejao for 31 G), his 13.6 TO% was nothing prepostrous -- NBA and Cavs being 13.4 -- and he's doing this at age 22.
That .503 TS% was just .006 worse than the Cavs' team shooting -- including guys who weren't there all season. So yeah, he could have given up a few shots, but to players who were likely no better.
Only half of the Cavs posted positive OWS last year. Is there a way to explain that, somewhat in layman terms?
e.g : Half their players should shoot less ?
Re: 2012 predictions
How about Offensive Rating vs Usage% --Hickson is the poster child for the usage-efficiency tradeoff. 2010: 58% TS, 18.9% USG; 2011: 50.3% TS, 25.5% USG
Code: Select all
year     Usg%   ORtg    U*O
2009    .180    102    18.4
2010    .189    109    20.6
2011    .255     98    25.0
Re: 2012 predictions
The other player I found that is a good example is Iverson when he went to Denver, although that has the confounding factor of changing teammates, as well. There are so many factors and so few data points. Tough nut to crack.
Re: 2012 predictions
The usage/efficiency tradeoff should be looked at from the lineup level (did Eli do that?)EvanZ wrote:The other player I found that is a good example is Iverson when he went to Denver, although that has the confounding factor of changing teammates, as well. There are so many factors and so few data points. Tough nut to crack.
Yes, Eli W. did this analysis: http://www.countthebasket.com/blog/2008 ... fficiency/
That pretty much sums up everything at a lineup level. Translating it back to the player level is more interesting...
Scott Sereneday (sp?) looked at this, generating curves for each player...but his work has been taken down.
Ryan J. Parker did some on his site as well: http://www.basketballgeek.com/2009/02/1 ... ll-curves/
Re: 2012 predictions
I read that Witus post a few months ago and forgot about it. Good one.
I remembered upon seeing Ryan's post that I had tried to do a similar analysis for Ellis and Curry last year.
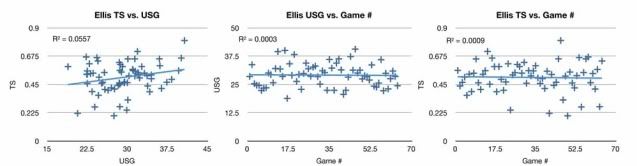
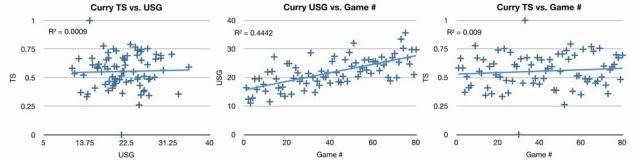
It looked like there was a little bit of a trend in TS vs. USG for Ellis, but not so much with Curry. I wasn't sure how useful this was.
I remembered upon seeing Ryan's post that I had tried to do a similar analysis for Ellis and Curry last year.
It looked like there was a little bit of a trend in TS vs. USG for Ellis, but not so much with Curry. I wasn't sure how useful this was.
Re: 2012 predictions
http://www.hoopdata.com/player.aspx?name=J.J.+HicksonEvanZ wrote:It's funny you mentioned "poster child" and Hickson. Here's a tweet I made yesterday:
Hickson is the poster child for the usage-efficiency tradeoff. 2010: 58% TS, 18.9% USG; 2011: 50.3% TS, 25.5% USG.
Looks like far fewer of Hickson's shots were assisted last year than the previous year. Could be a non-usage reason for his percentage to drop. Confusingly, his FG% dropped in close (at rim and within 9 feet) where he took the same number/a few more shots per 40 minutes, but his accuracy went up (along with more shots) from 10 to 23 feet. His percent blocked wasn't any higher, so presumably that wasn't an issue with the at-rim decline. So he took more bad shots but was better at them; he took a few more closer shots but was worse at them. Is that an obvious/typical usage-related story? If we had this conversation last year, we might also consider him a (smaller sized) poster child for the anti-tradeoff story: 2009 54.8% TS, 18% USG; 2010 58% TS, 18.9% USG.
Re: 2012 predictions
The confusing thing about skill curves is that each player has 2: assisted attempts vs. not assisted attempts. Assisted attempts will likely have very little decreasing returns (it's just hard to get them) while un-assisted shots will have a very large amount of diminishing returns, except for a few exceptional players (Kobe, Carmelo seem to be some of them).
Re: 2012 predictions
I agree with Daniel, and would just throw out there that typically when USG is increased it comes off of additional unassisted mid-range shots which are obviously lower efficiency. If, however, somehow a player is able to create more dunk attempts for himself (say DeAndre Jordan getting more lobs this season), I would hypothesize that his USG won't decrease much at all.
To sum up my opinion, it's not the increase in USG per se, but the increase in certain types of shots. I've been saying for a while that Monta Ellis should take fewer mid-range jumpers because he's not that good at them. Let Curry take more of those. What would happen is that Ellis' efficiency would increase at the expense of Curry by a transfer of these shot types.
In mechanics we would think of this as a conservation problem. Maybe we can call it conservation of efficiency or something.
Re: 2012 predictions
Hickson's lines may be typical of what happens when the best offensive player in the world is removed from your lineup, and then your best remaining player goes down, and you're the go-to guy from 10-20 feet and also inside.
A lot of assisted inside shots became a lot of outside shots and unassisted inside shots. In both cases, they're "worse" shots than he took the previous year, but LeBron isn't coming down the lane and drawing 3 defenders in 2011.
A lot of assisted inside shots became a lot of outside shots and unassisted inside shots. In both cases, they're "worse" shots than he took the previous year, but LeBron isn't coming down the lane and drawing 3 defenders in 2011.
-
huevonkiller
- Posts: 146
- Joined: Sun Apr 17, 2011 9:36 pm
- Location: Miami, Florida
Re: 2012 predictions
I think going 46-20 would be nice, I do not really care about that. Personally I think the Heat should indeed take some games off. But their depth was still worse last year.
Mike, Big Z was not a great player and was useless overall. Big Z was a horrible defender in MIami just like he was a horrible defender in Cleveland's 60 win seasons. I think he had the worst +/- in the first round of the playoffs last year, before getting benched.
Offsetting the loss of Bibby? Bibby was a terrible defender and player last year. Juwan Howard? He should not have been re-signed at all even if he got slightly better.
The Heat's bench was extremely weak last season, with a PER around 10 and at the bottom of the league.
Also Joel Anthony was an extremely unproductive center. If the Heat experiment at all with their frontcourt (perhaps more LeBron/Battier/Miller/Pittman/RandomGuy) they'll outdo themselves.
http://www.82games.com/1011/1011MIA.HTMMike G wrote:I have the Heat at 46-20, equivalent to 58 wins in 82 games, same as last year.
Ilgauskas was productive for most of the year, and he's gone.
Battier and a healthy Haslem should help, offsetting expected declines by Miller, Jones, Howard, and the loss of Bibby.
General note: In this century, looking at 288 rookies who had 500+ minutes and also 500 minutes in year 2, avg increase in WS/48 from yr 1 to yr 2 is .013 .
So I'm expecting improvements in eW/484 to be +.13 for last year's rookies.
Mike, Big Z was not a great player and was useless overall. Big Z was a horrible defender in MIami just like he was a horrible defender in Cleveland's 60 win seasons. I think he had the worst +/- in the first round of the playoffs last year, before getting benched.
Offsetting the loss of Bibby? Bibby was a terrible defender and player last year. Juwan Howard? He should not have been re-signed at all even if he got slightly better.
The Heat's bench was extremely weak last season, with a PER around 10 and at the bottom of the league.
Also Joel Anthony was an extremely unproductive center. If the Heat experiment at all with their frontcourt (perhaps more LeBron/Battier/Miller/Pittman/RandomGuy) they'll outdo themselves.
Re: 2012 predictions
Here are two sets of predictions. The first is a "massaged" 2-yr average of ezPM. The second is that averaged with Jerry's RAPM. Like Mike, these predictions inflated win totals, the first set by 10%, the second by 5%. These are the corrected predictions, of course.
2-yr ezPM with "massaging"
ezPM blended with RAPM
2-yr ezPM with "massaging"
Code: Select all
EAST	WIN%   W     L
MIA	81.7%	54	12
ORL	68.3%	45	21
CHI	67.8%	45	21
BOS	63.2%	42	24
ATL	56.6%	37	29
PHI	54.0%	36	30
NYK	50.3%	33	33
IND	48.9%	32	34
MIL	47.4%	31	35
NJN	37.4%	25	41
CHA	36.3%	24	42
DET	31.7%	21	45
TOR	31.3%	21	45
CLE	28.6%	19	47
WAS	23.6%	16	50
WEST
OKC	67.3%	44	22
LAL	64.7%	43	23
LAC	64.6%	43	23
DAL	62.6%	41	25
SAS	58.4%	39	27
POR	53.6%	35	31
MEM	53.5%	35	31
DEN	52.8%	35	31
PHO	52.3%	35	31
HOU	47.6%	31	35
GSW	44.0%	29	37
UTA	38.6%	25	41
NOH	37.5%	25	41
SAC	35.8%	24	42
MIN 32.8% 22 44Code: Select all
EAST	WIN%   W     L
MIA	83.0%	55	11
BOS	69.9%	46	20
CHI	68.6%	45	21
ORL	66.1%	44	22
ATL	56.2%	37	29
NYK	55.0%	36	30
PHI	53.7%	35	31
MIL	52.3%	35	31
IND	49.2%	32	34
NJN	36.1%	24	42
DET	32.4%	21	45
CLE	31.8%	21	45
CHA	31.7%	21	45
TOR	28.0%	18	48
WAS	26.7%	18	48
WEST
DAL	68.1%	45	21
OKC	66.4%	44	22
LAL	65.8%	43	23
SAS	59.2%	39	27
POR	57.8%	38	28
LAC	57.4%	38	28
MEM	56.9%	38	28
DEN	53.6%	35	31
PHO	46.4%	31	35
HOU	43.5%	29	37
GSW	42.8%	28	38
UTA	39.3%	26	40
NOH	35.6%	24	42
MIN	30.9%	20	46
SAC 27.6% 18 48Re: 2012 predictions
Boston, Dallas, New York and Portland are upper tier teams which benefit 3-4 games by the RAPM blending. Clips lose 5, Phoenix 4.
Mike had 7 .600+ teams; you have 7 with EZPM, 8 with the blend.
Mike's projections are more pessimistic for Miami and OKC than your projections (by 7-8 and 5). His are more bullish... for the Bulls (by 5).
I am not immediately following this: "Like Mike, these predictions inflated win totals, the first set by 10%, the second by 5%. These are the corrected predictions, of course." Could you explain this a different, fuller way?
Conceptually I like ezPM blended with RAPM. My off the cuff reaction to its projections is that Boston and Orlando are the main top tier teams that seem too high to me but most of the blend's team projections are in the ballpark of where I might put them subjectively.
Re: 2012 predictions
When I'm assigning (guessing) minutes, I'm a bit biased and think coaches should cut minutes for weaker (eW/484) players and give them to better players. I try not to do it so much, but it apparently happens. This gives predictions which add up to more wins than games played. Mine were 11% too high.Crow wrote: I am not immediately following this: "Like Mike, these predictions inflated win totals, the first set by 10%, the second by 5%. These are the corrected predictions, of course." Could you explain this a different, fuller way?
There must be some reasons that Raja Bell and Shane Battier get a lot of minutes; they just don't show up in the boxscore. I did try to not cut anyone's minutes by more than 50%, and still there were teams with too many players deserving minutes, so it happens.
How are we gonna share our minutes projections? It seems a bit premature. Free agents are still signing -- about 12 guys with 1000-2000 minutes last year are yet to appear on any roster, as far as I can tell.