Page 1 of 8
"Points Above Average"
Posted: Tue Apr 07, 2015 2:20 pm
by BasketDork
So, I was tinkering around a little, and came up with my own little shooting statistic. It is by far, not meant to be some end-all, be-all metric, rather just something to toy with and get an idea of how a player shot vs. the league average. I started out by gathering league average 2pt FG%, 3pt FG%, and FT%. This system favors 3 point shooters, punishes high shot volume, and doesn't take anything other than 2pt FG, 3pt FG, and Free Throws into account. As an example, we'll use Michael Jordan's highest rated season in my system, 1989-1990, Lg Avg 2P % was .488, FT% was .764, and 3P% was .329, Jordan went 942-1719 (.548) from 2, 92-245 (.376) from 3, and 593-699(.848) from the stripe. Jordan's 1719 2pt att * lg Avg .488 = 838.872 , he made 942 2's, so 942 - 838.872 = 103.128 2's above average, he shot 245 3pt att* lg Avg .329= 80.605, Jordan made 92, so 92-80.605 = 11.395 3's above average, Jordan shot 699 FT att* .764 =534.036 ft, he made 593, so 593-534.036 = 58.964 FT above average. We then take those 3 "makes above average" totals and multiply their corresponding point totals, for example, Jordan's '89-80 : (103.128 * 2) + (11.395 * 3) + (58.964 * 1) = 299.405 "Points Above Average", essentially saying that an average player in 1989-1990, taking the same number of FG's and FT's as Jordan, would score 299.4 points fewer in that spot. I know it doesn't account for teammates, strength of opponents, opportunity, pace, or anything else. Anyone think I can add anything to it to improve upon it or make it more interesting? I only ran Jordan's, LeBron's and Kobe's regular season and playoffs totals, and am currently calculating Larry Bird. Feedback is welcomed and appreciated!
NOTE:
I've since decided to calculate using TS%
Re: "Points Above Average"
Posted: Tue Apr 07, 2015 2:38 pm
by BasketDork
Disregard comment.
Re: "Points Above Average"
Posted: Tue Apr 07, 2015 4:15 pm
by italia13calcio
Interesting idea. I've been doing this with the SportVu data for a while, but never thought about applying it to regular stats.
Re: "Points Above Average"
Posted: Tue Apr 07, 2015 6:04 pm
by EvanZ
I worked on an "adjusted" shooting metric like this a few years back (2010-11) which took into account inside, mid-range, 3pta, and free-throws.
 http://www.d3coder.com/thecity/2011/12/ ... -by-psams/
Here are links to the posts back then:
(inside)
http://thecity2.com/2011/09/20/position ... e-scoring/
(mid-range)
http://thecity2.com/2011/09/24/position ... -shooting/
(3pt)
http://thecity2.com/2011/09/30/position ... -shooting/
(free throws)
http://thecity2.com/2011/10/02/position ... -shooting/
That should give you some perspective on where to go from here.
Re: "Points Above Average"
Posted: Wed Apr 08, 2015 12:50 am
by Mike G
Michael Jordan's highest rated season in my system, 1989-1990, Lg Avg 2P % was .488, FT% was .764, and 3P% was .329, Jordan went 1034-1964 (.526) from 2, 92-245 (.376) from 3, and 593-699(.848) from the stripe...
Actually, Jordan was 1034/1964 on
all FGA; his 2-pt FG shooting was 942/1719 (.548)
The resulting PAA would be +103.1 from his 2fga, and +172.9 from all shots.
Would you get the same total PAA by the formula (TS%-leagueTS%)*TSA*2 ?
Re: "Points Above Average"
Posted: Wed Apr 08, 2015 1:21 am
by Mike G
BasketDork wrote:Jordan's career PAA
Year R.S. Playoff
...
96-97 83.27 -7.06
...
In the '97 Playoffs,
average players might have scored 7 points more than Jordan, on the same number of shots?
The Bulls went thru .537 Was, .683 Atl, .744 Mia, and .780 Utah in that postseason. Not really average players.
By D-Rtg, those teams ranked 13, 3, 1, and 10 respectively.
And how did Jordan's shooting compare to those good-to-excellent teams', and to the Bulls'?
Code: Select all
1997 PO    3fga   3fg%    2fga    2fg%    fta     ft%
Bulls      364    .319    1160    .468    441    .735
opponents  351    .356     997    .446    524    .740
Jordan      67    .194     431    .497    148    .831
PAA          -10.9            22.0           13.5
This yields a net PAA of +24.6 -- a difference of about 1.7 ppg -- relative to competition vastly superior to
average.
Last year, the median eFG% of playoff teams was .515, and they held their opponents to .490 -- in the RS.
In PO, everyone shot .505
In 2013, the RS numbers were about the same, and in PO thudded to .486
Re: "Points Above Average"
Posted: Wed Apr 08, 2015 3:44 am
by BasketDork
I looked at the wrong column when going through the 89-90 Jordan example, You're correct. I imagine that the TS%-Lg TS% formula would net me the same result. I just went quick & dirty for playoffs, not the exact numbers for the corresponding year's postseason. I could use opponent SRS or SOS or opponents DefRtg as a way to get an idea of how rough of a road throughout the playoffs each player took. I think I'm going to split rs/playoff lg averages, and start calculating for every season back to 79-80 ( 3 point line introduced) , I need a reasonable cutoff, like minutes, then the top "" in FGA, top "" in FG%, same with FT's, 3Pointers, and like Top 20 in TS%, and scoring, I don't wanna run through like 400 players for each year, anyone have an idea to where I'd arrive at all my PAA leaders for a given year, while eliminating a lot of the unnecessary players who wouldn't make the top 20, top 50 ?
Re: "Points Above Average"
Posted: Wed Apr 08, 2015 11:33 am
by BasketDork
I realized (TS%-lg Avg TS%)*TSA*2 should get me there, as for playoffs, I'll adjust the TS% to reflect playoff average, as for a defensive adjustment for the playoffs (which I think is pretty cool, and more accurate, what should I use? I've thought about adding REB, AST, STL, BLK, TOV Above/below average, thoughts? I've also come up with a "shooting index, much like versatility index but multiplied by 100, rather than cubed..
Re: "Points Above Average"
Posted: Wed Apr 08, 2015 1:41 pm
by Statman
BasketDork wrote:I realized (TS%-lg Avg TS%)*TSA*2 should get me there, as for playoffs, I'll adjust the TS% to reflect playoff average, as for a defensive adjustment for the playoffs (which I think is pretty cool, and more accurate, what should I use? I've thought about adding REB, AST, STL, BLK, TOV Above/below average, thoughts? I've also come up with a "shooting index, much like versatility index but multiplied by 100, rather than cubed..
I expect this thread to start turning into a usage debate again - and Iverson will eventually make his way in with a dab of Westbrook.
Re: "Points Above Average"
Posted: Wed Apr 08, 2015 5:18 pm
by BasketDork
That's why I was thinking of incorporating other box score numbers above or below average, to get a clearer picture. We all know efficiency drops with Usage, whether it be A.I., Westbrook, or Kobe. I think Russell Westbrook's triple doubles are silencing critics FOR NOW, but he's had some awful 10-32, 9-30, 9-29 type nights like always. The thing about Iverson is he never had much of a second option. Westbrook can make that case this year, however, even when Durant's 100%, he still chucks it like crazy. Kobe's another player that always gets the "well, who else does he have ?" benefit of the doubt. I was merely looking for a way to sharpen/improve the PAA statistic.
Re: "Points Above Average"
Posted: Wed Apr 08, 2015 7:52 pm
by AcrossTheCourt
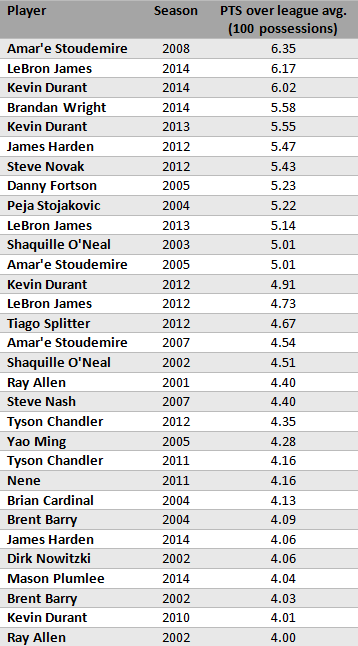
I actually have already created something called points above average.
It's essentially TS% - league average set to points. A 0 means you shoot at the league average.
Here's a list of the top guys since 2001 per 100 possessions:
http://bloguin.com/analyticsgame/wp-con ... verage.png
Before we get into the whole chucking/Iverson/inefficiency thing, I just wrote something pertinent. Efficiency is only one facet of the game. Remember that. OKC does really well with Westbrook, and his usage drops a ton when he plays next to Durant.
http://nyloncalculus.com/2015/04/06/jam ... f-scoring/
Re: "Points Above Average"
Posted: Wed Apr 08, 2015 10:52 pm
by BasketDork
I'm trying to form a building block toward something different though.. and incorporate other box score statistics, like Reb+, Ast +, etc. Similar to ERA+ in sabrmetrics or the QB passing indices you find on profootball-reference..
Re: "Points Above Average"
Posted: Thu Apr 09, 2015 11:08 am
by Statman
BasketDork wrote:I'm trying to form a building block toward something different though.. and incorporate other box score statistics, like Reb+, Ast +, etc. Similar to ERA+ in sabrmetrics or the QB passing indices you find on profootball-reference..
My ratings pretty much do this - since I normalize stats every season separately for each league before I produce the ratings. The ratings are then done at the team level (adjusting for pace, defense, teammates, etc) and broken down to the player level. These ratings care broken down even further to the stat level (2pt fg, 3pt fg, reb, whatever), and can be compared to league average. I don't always post that info, since I think what I do post is already too much for many normal fans to try to start wrapping their brain around - info overload.
This all allows me to be compare players from different eras or even leagues (either compare player types or create conversions from league to league when I have enough data like I do with college, D league, & NBA).
A good example would be my draft projections from last season:
link:
http://hoopsnerd.com/?p=626 spreadsheet:
http://hoopsnerd.com/wp-content/uploads ... pload.xlsx
If you notice the spreadsheet I give almost all the projection breakdowns there for every projected season with league average at the top. The only ones I don't have are 2's, 3's, & ft's broken down into made & missed - they are combined ratings of made & missed.
Anyway, any none combined rating (doesn't combine "positive" & "negative" stats) could easily be converted to an ERA+ type rating.
For example, Marcus Smart projected the best steal rating for a career. High 25.9 in '15, Low 21.0 in '31. With the league average of 11.7 I show at the top, this would be a 222 Stl+ in '15, a 180 Stl+ in '31.
Note the other end of the spectrum: Doug McDermott's Stl+ to be a career high of 16, low of 14. Combine that with a Bk+ ranging for 10 down to 7 (these would be like NBA historical lows for any player playing at least a hand ful of minutes) - one can see why model projected him to be such a liability on the defensive end that he projected almost no career playing time. My new model might be a little more forgiving, but not much.
Re: "Points Above Average"
Posted: Thu Apr 09, 2015 1:01 pm
by permaximum
AcrossTheCourt wrote:
Before we get into the whole chucking/Iverson/inefficiency thing, I just wrote something pertinent. Efficiency is only one facet of the game. Remember that. OKC does really well with Westbrook, and his usage drops a ton when he plays next to Durant.
http://nyloncalculus.com/2015/04/06/jam ... f-scoring/
Did you write that article? I liked it. I guess you are also the one who did this retrodiction test.
http://ascreamingcomesacrossthecourt.bl ... trics.html
I liked it too. Thank you.
We need an out-of-sample prediction contest in the same vein that includes public and potentially private metrics that cover 1974-2015 era to highlight the prediction accuracy change with the roster turnover. It would help tremendously when we compare players and predict the next season win totals by taking roster turnover of NBA teams into account.
Neil Paine was suppossed to do that. But here we are.
Re: "Points Above Average"
Posted: Thu Apr 09, 2015 1:51 pm
by J.E.
Seek professional help