Page 1 of 1
Pace of Play Calculations
Posted: Fri Apr 29, 2016 9:44 pm
by OnKPDuty
This is from another since-disappeared user in some long-ago post:
"The 'pace' that a team records in a season is actually the average of league avg pace and that team's innate pace.
The Clippers are an avg pace team at 95.8 poss/48. The Jazz are slowest at 91.0.
"When they meet, the Clipps play their possessions at a pace of 95.8/48 min.
The Jazz play as many possessions; and apparently they are trying to play at a pace = 91.0 - (95.8-91.0) = 86.2
"With half the possessions played at 95.8 and half at 86.2, we expect the game to be played at (95.8 + 86.2)/2 = 91.0
If the Jazz played another "91.0" team, we could expect the game to have 86.2 poss/tm."
To which I responded: "So the Jazz are tying to play slower but basically the Clippers won't let them? So if the Jazz were to play a team with an average identical pace of 91, you can instead expect a pace of 86.2 (assuming 95.2 is the average pace of all their past opponents)? I didn't know this. Is this generally considered to be true and/or even common knowledge? Ty."
He has yet to, and probably never will, reply back. So I though I'd pose my response to the entire community to better understand what he meant. Am I anywhere within the vicinity of the right track? Thank you.
Re: Pace of Play Calculations
Posted: Fri Apr 29, 2016 10:19 pm
by Crow
"apparently they are trying to play at a pace = 91.0 - (95.8-91.0) = 86.2"
this is a supposition that they are playing in a way to make the game actual equal their combined avg. pace. that is reasonable and on average they may have. but we don't know for sure that the clippers will play themselves at 95.8 against them. we just know that they do on average combined. if the clippers play teams that average the league average pace then the supposition about the Clippers own pace is true. but it may not be.
"If the Jazz played another "91.0" team, we could expect the game to have 86.2 poss/tm."
91 avg. combined pace vs 91 combined pace does imply that both play their half of the game at 86.2 and are countered by league avg. pace by other team to achieve that combined average pace of 91. But when they play each other they are countered by a team playing at 86.2 themselves using the above logic. So yes, we would expected average combined pace of (86.2 and 86.2) / 2 to equal 86.2. If these are in fact the numbers for own pace. And teams control own pace completely.
So this isn't neat and clean.
If one had own average pace & your average opponent pace settings faced while setting that own average pace, and opponent pace & average opponent of the opponent paces one would know more. It doesn't stop there; but I probably would.
Re: Pace of Play Calculations
Posted: Sat May 07, 2016 8:30 pm
by Mike G
Re: Pace of Play Calculations
Posted: Sun May 22, 2016 6:22 am
by tarrazu
Has the effect of offensive "control" for average possession length been explored for NBA?
This was a post from Kenpom as it pertains to college basketball:
http://kenpom.com/blog/index.php/weblog ... ion_length
Re: Pace of Play Calculations
Posted: Sun May 22, 2016 4:57 pm
by Kevin Pelton
Not in exactly the same way, but Mike Beuoy's research effectively shows the same thing:
http://www.inpredictable.com/2015/03/of ... n-nba.html
Offensive and defensive possession lengths available for this season here:
http://stats.inpredictable.com/nba/ssnTeamPoss.php
Re: Pace of Play Calculations
Posted: Sun May 22, 2016 11:00 pm
by Mike G
Interesting. Defensive half of possessions range from 15.3 sec. (Mil) down to 14.2 (Phl). Offensively, teams vary from 13.5 (GSW) to 16.3 (Uta) -- about 2.5 times as wide a range.
This year's NBA avg Off Poss (and Def Poss) was 14.85 sec.
So pace, calculated as 60/(OPoss+DPoss)*48 = 97.0
According to b-r.com, it was 95.8
Teams range from 1.0% to 1.7% higher in the (O+D) calc -- or 0.9 to 1.6 poss/G more than b-r.com says.
Re: Pace of Play Calculations
Posted: Mon May 30, 2016 4:39 pm
by tarrazu
New post from Mike Beuoy of inpredictable.
"More rigorously, if we build some simple regression models[3] for offensive pace, we get the following[4]:
Team offense explains 39.1% of the variance in seconds per possession
Team defense explains 7.2% of the variance in seconds per possession
The combination of team offense and team defense explains 43.2% of the variance in seconds per possession"
http://www.inpredictable.com/2016/05/is ... gious.html
Re: Pace of Play Calculations
Posted: Tue May 31, 2016 5:31 am
by shadow
Mike G wrote:Teams range from 1.0% to 1.7% higher in the (O+D) calc -- or 0.9 to 1.6 poss/G more than b-r.com says.
He explained why his pace metrics are higher than b-r.com
here:
"Just a note on the possession counts: These do not precisely align with those you find on sites like basketball-reference.com. In general, I am counting more possessions on average than what is usually tallied using the box score, which results in slightly lower efficiencies. The main reason for this, I believe, is that my method counts "end of quarter" possessions that do not result in a typical box score "possession marker", like a made/missed shot or a rebound. If a team gets the ball with 10 seconds left and fails to get a shot off, that will likely not count as a possession using the box score stats, but is counted as such by my method."
Re: Pace of Play Calculations
Posted: Tue May 31, 2016 6:29 pm
by Mike G
Cool, that makes sense.
That info must come from play-by-play. If so, one could just count 6 seconds at the end of a quarter as 6/24 or .25 possession. That would make more sense in terms of efficiency for the game, since you are not as efficient in such a fraction of a whole 24 sec. possession.
Re: Pace of Play Calculations
Posted: Wed Jun 29, 2016 7:28 pm
by zhang8787
I made this post elsewhere but nothing, I thought this would be a much better place to ask.
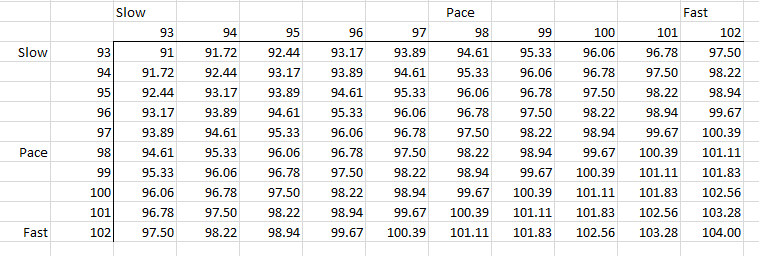
I am trying to figure out a basketball situation. In a regular length basketball game, the average possessions (or PACE) each team has is 97.5. In any given game, because each team trades possessions, they will usually have the same PACE. When looking at the NBA, the range I have found is from 93 to 102 possessions (slowest to fastest PACE).
I have found when the slowest and fastest teams (93 and 102 PACE) face each other, they will average 97.5, the overall average. This seems logical.
However, I have found when teams of 102 PACE face each other, they average 104. When two teams of 91 PACE face each other, they average 89. It is logical for two teams of 102 to exeed their average PACE, as it is logical for two teams of 93 to fall below their average. However, is there a mathematical way to solve for the difference from their respective averages? Also is there a way to solve the average PACE of any two given teams (102 vs 95, 95 vs 99, etc)?
I've come up with a crude table in an attempt, but it doesn't seem like it's very practical, and I would like to know the concept behind this.
I also put this into golf terms when asking a friend to see if it made more sense.
Let me create the situation. There is 11 golfers and 11 golf courses. Actually the number of each is irrelevant.
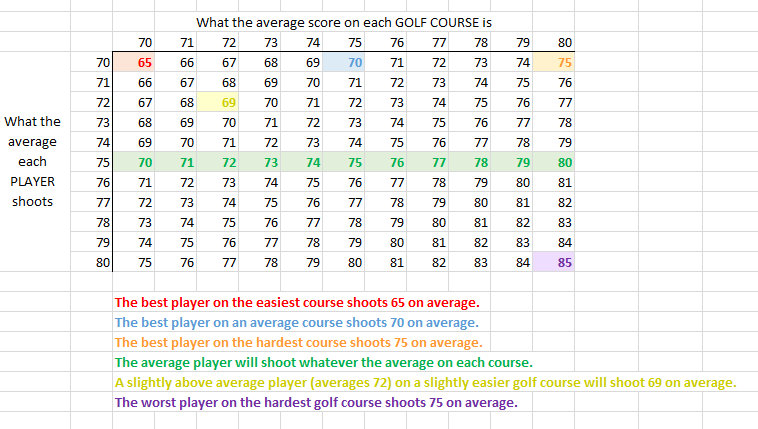
When the #1 golfer plays every golf course, he shoots 70 on average. When the #11 golfer plays every golf course, he shoots 80 on average. The #6 golfer is an average golfer, and he shoots 75 on average.
So basically when each plays every course, #1player averages 70, #2player averages 71, #3player averages 72, ... #11player averages 80.
Now something else is the golf course difficulty. When everyone plays on the toughest golf course, they average 80. On the easiest course, they average 65.
Here is a table that could explain it better visually:
Inline image 2
As you can see, when the best golfer plays the easiest course he shoots 65. When the worst golfer plays the hardest course, he shoots 85.
A common misconception is to average - when an 70 golfer plays on a 75 course, many would assume he would shoot 72.5. When in fact, a 70 golfer on average will shoot 70 on an average course.
-------------------------------------------------------------
I'm not sure if this makes sense to you. If it does, my question is this:
The best golfer who shoots 70 playing on a course that allows 70 on average, those 2 factors combined makes his average lower than 70. When the worst golfer who shoots 80 plays on a course that allows 80 on average, those 2 factors combined makes his average higher than 80. This is one of the basic, most important ideas. So my question is, is there a math model that calculates how much lower than 70 and how much higher than 80 in this situation?
Also, is there a way to calculate if a 77 golfer plays on a 72 golf course, without using the table? If I am given a random player and a random golf course, how can I calculate his average score?
I think this could provide some value to this discussion, and other things in regards to vs. average stats. I'm just curious if there is a mathematical basis behind it, if range of best/best vs worse/worse is needed. What I mean by this is when a 102 pace team plays vs 102 pace team, their pace is 104, and when 93 plays vs 93, their pace is 91.
Another question would be how would you calculate a starting 5 of players with different paces? One weird thing I noticed was sometimes a starting 5 would have a pace of 99 individually (not necessarily together), however when combined, their lineup PACE is lower. Which is weird when 99 is higher than the average, and goes against the ideas above (which a decent sample size agrees with)
Re: Pace of Play Calculations
Posted: Thu Jun 30, 2016 2:10 pm
by DSMok1
Ken Pomeroy predicts tempo like this:
Expected Pace = Team1Pace% * Team2Pace% * Average Pace
So a game between two teams that are 93/98 = 95% of average would be predicted to come in at 0.95*0.95*98 = 88.5
Some variation on this approach probably gets you a more exact fit.
Re: Pace of Play Calculations
Posted: Sun Jul 03, 2016 3:46 pm
by Mike G
Expected Pace = Team1Pace% * Team2Pace% * Average Pace
Average this year was 95.8. We might assume all teams'
opponents sum to very near this avg.
The formula above can be shown as:
expected Pace = Tm1Pace/95.8 * Tm2Pace/95.8 * 95.8
... which simplifies to:
xP = P1*P2/95.8
This is as simple as the formula I gave (in the concurrent thread) --
xP = (P1-95.8) + (P2-95.8) + 95.8 ... or
xP = P1 + P2 - 95.8
example: Sac (P1=100.0) vs GSW (P2=99.3)
First formula expects a game pace of 103.65, 2nd expects 103.50 -- no real difference.
Zhang8787 reports something else:
However, I have found when teams of 102 PACE face each other, they average 104. When two teams of 91 PACE face each other, they average 89.
His NBA avg is 97.5, so there are alternative estimations; we'll go with 97.5 .
The formulae above then expect two 102-pace teams to have a 106.6 pace.
The 91-pace teams
should play at around 84.7
If two
fast teams don't play a game quite as fast as expected, it's likely due to one or both coaches trying to gain some advantage. Steve Kerr may think his team is better vs. the Kings when the pace is slower. Against
most NBA teams, speed is to his advantage; but not against a team that may
only play well at high pace.
Similarly, the Grizz may feel better able to compete vs the Jazz by turning up the tempo. What works against most teams -- slowing it down -- works less well (or not at all) vs an opponent that also loves the slow pace.