Jon Nichols
Joined: 18 Aug 2005
Posts: 370
PostPosted: Sat Jun 27, 2009 1:48 pm Post subject: Developing a Measure for Evaluating Coaches, Part I Reply with quote
Today I published my first of three steps in which I attempt to develop a rating for head coaches. The first step involves measuring their impact on a team's effort level. I used rebounding numbers and two stats from 82games.com for this. To see the article and a link to the numbers, go to:
http://basketball-statistics.com/develo ... part1.html
I would love to hear some feedback on this. The methodology is a bit simplistic, but I think it's reasonably accurate.
Thanks,
Jon Nichols
Back to top
View user's profile Send private message AIM Address
Crow
Joined: 20 Jan 2009
Posts: 821
PostPosted: Sun Jun 28, 2009 3:59 am Post subject: Reply with quote
It is hard to separate player from coaching impact.
And it is early so I don't know for sure where you are going with the other two parts -offense and defense.
But at this time I'd say this first part you've done may be better for documenting that a certain sized part of team success or underperformance was due to these types of efforts than in separating player and coaching shares. And this is a mix, mostly defense but a mix and maybe not the cleanest one. Looking at the coaches high and low on this effort index it is heavily influenced by the quality of rebounders and the philosophy on fouling. Might be better to try to separate these.
Using your article to start thinking about this but to take my stab at it I might divide offense into shot offense (as represented by eFG% and FT/FG), floor game and offensive rebounding, and defense similarly.
For each part I'd try to separate player and coaching impacts but it will be subjective and crude under a simple model.
For shot offense I might credit players with say 80% of the performance above or below league averages for FG%s from 3 point, mid-range and inside compared to an average shot distribution and 20% coach. But for the impact of getting more better shots (3 pointers or inside) vs mid-rangers I might give the coach more credit - say 40% for the edge specifically created by that better shot chart . Setting these shares seems subjective though maybe a sophisticated regression could try to determine the "right" shares.
For floor game I don't know maybe I'd go 60% player, 40% coach compared to average.
For offensive rebounding I'd probably go 80% player, 20% coach.
Maybe others would disagree with these differing shares. But mentioning them might lead to some discussion.
For shot defense I'd probably bump the coach's shares up by at least 10% points on each. I think it is on target to suggest that coaching matters more here.
For the other defensive items I'd probably bump them by 10% points too
To the extent you have it, player performance under other coaches before and after age adjusted might help with coaching impact but you wouldn't be able to this evenly for all players so it would be hard to apply.
With more time you might be able to adjust rebounding performance by average height on the floor weighted by position importance for rebounding. With even more time and resources you might be able to at least try to adjust by true length (standing reach + hops). I guess you could hypothetically do the same with wingspan and lateral speed (estimated by agility run score) for floor game. But these are big efforts and a lot of the variation will still be based on the player rather than the coach.
That's my 2 cents for your consideration.
Back to top
View user's profile Send private message
Jon Nichols
Joined: 18 Aug 2005
Posts: 370
PostPosted: Sun Jun 28, 2009 9:30 am Post subject: Reply with quote
Crow wrote:
It is hard to separate player from coaching impact.
And it is early so I don't know for sure where you are going with the other two parts -offense and defense.
But at this time I'd say this first part you've done may be better for documenting that a certain sized part of team success or underperformance was due to these types of efforts than in separating player and coaching shares. And this is a mix, mostly defense but a mix and maybe not the cleanest one. Looking at the coaches high and low on this effort index it is heavily influenced by the quality of rebounders and the philosophy on fouling. Might be better to try to separate these.
Using your article to start thinking about this but to take my stab at it I might divide offense into shot offense (as represented by eFG% and FT/FG), floor game and offensive rebounding, and defense similarly.
For each part I'd try to separate player and coaching impacts but it will be subjective and crude under a simple model.
For shot offense I might credit players with say 80% of the performance above or below league averages for FG%s from 3 point, mid-range and inside compared to an average shot distribution and 20% coach. But for the impact of getting more better shots (3 pointers or inside) vs mid-rangers I might give the coach more credit - say 40% for the edge specifically created by that better shot chart . Setting these shares seems subjective though maybe a sophisticated regression could try to determine the "right" shares.
For floor game I don't know maybe I'd go 60% player, 40% coach compared to average.
For offensive rebounding I'd probably go 80% player, 20% coach.
Maybe others would disagree with these differing shares. But mentioning them might lead to some discussion.
For shot defense I'd probably bump the coach's shares up by at least 10% points on each. I think it is on target to suggest that coaching matters more here.
For the other defensive items I'd probably bump them by 10% points too
To the extent you have it, player performance under other coaches before and after age adjusted might help with coaching impact but you wouldn't be able to this evenly for all players so it would be hard to apply.
With more time you might be able to adjust rebounding performance by average height on the floor weighted by position importance for rebounding. With even more time and resources you might be able to at least try to adjust by true length (standing reach + hops). I guess you could hypothetically do the same with wingspan and lateral speed (estimated by agility run score) for floor game. But these are big efforts and a lot of the variation will still be based on the player rather than the coach.
That's my 2 cents for your consideration.
Thanks for the tips. My goal isn't to tie these ratings to team success yet, but eventually that would be the point. It's obvious that Jerry Sloan rates so highly because he encourages his teams to foul liberally. However, I think it's also the case that his teams do give maximum effort and I hope that this is at least partly reflected in the numbers.
Adjusting these numbers based on each team's true height is actually a great idea and something I should consider doing.
Back to top
View user's profile Send private message AIM Address
jmethven
Joined: 16 May 2005
Posts: 51
PostPosted: Sun Jun 28, 2009 2:22 pm Post subject: Reply with quote
Obviously encouraging players to play harder is not the coach's only job, but I like what you have come up with so far. Jerry Sloan and Scott Skiles are two coaches who have a system and get players to buy into it so it makes sense that they would rate so high on a measure like this one. Skiles, in particular, has a 'magical' ability to improve team defense when he takes over a team - this has to be related to him having a system that rewards effort and being able to encourage players to buy in.
I will be interested to see the other ways you approach this subject. Late-game strategy would be a really interesting one. That seems to be what Bill Simmons harps on the most when he evaluates coaches. At the college level, you hear more about coaches who motivate, but I believe at the professional level, coaches are expected to be strategists more than motivators.
Back to top
View user's profile Send private message
Jon Nichols
Joined: 18 Aug 2005
Posts: 370
PostPosted: Sun Jun 28, 2009 3:36 pm Post subject: Reply with quote
jmethven wrote:
Obviously encouraging players to play harder is not the coach's only job, but I like what you have come up with so far. Jerry Sloan and Scott Skiles are two coaches who have a system and get players to buy into it so it makes sense that they would rate so high on a measure like this one. Skiles, in particular, has a 'magical' ability to improve team defense when he takes over a team - this has to be related to him having a system that rewards effort and being able to encourage players to buy in.
I will be interested to see the other ways you approach this subject. Late-game strategy would be a really interesting one. That seems to be what Bill Simmons harps on the most when he evaluates coaches. At the college level, you hear more about coaches who motivate, but I believe at the professional level, coaches are expected to be strategists more than motivators.
The next step is to implement coaches' impacts on offense and defense, and I would be interested to hear people's ideas on how this could be done. I know Berri has already looked at how coaches impact individual players, so I was hoping to look at them more on the team level. I already have their career offensive and defensive ratings, but that is obviously heavily player-dependent. I've considered looking at how teams' offensive and defensive ratings change once a new coach is hired, but certain coaches (such as Popovich and Sloan) have been with the same teams for so long that it would be useless. Any ideas?
Back to top
View user's profile Send private message AIM Address
Crow
Joined: 20 Jan 2009
Posts: 821
PostPosted: Mon Jun 29, 2009 3:19 am Post subject: Reply with quote
I am not immediately sure how to weight absolute performance vs year to year improvement for offense and defensive overall but there might be some context specific function that fairly treats these across the spectrum in a way that hints at coaching impact.
Also not sure if you are interested in this part or not but for offense and defense but I'd really emphasize looking at % of shots taken from high percentage shot zones (inside or from 3) vs mid-range and look for signs of the system /execution getting smarter year to year to get at coaching impact. Coaches can't make the ball go in and have different talent levels for this skill but they should be able to influence where it goes up from. This is coaching intelligence, a counterpart to coaching effort.
Back to top
View user's profile Send private message
Jon Nichols
Joined: 18 Aug 2005
Posts: 370
PostPosted: Mon Jun 29, 2009 8:48 am Post subject: Reply with quote
Crow wrote:
I am not immediately sure how to weight absolute performance vs year to year improvement for offense and defensive overall but there might be some context specific function that fairly treats these across the spectrum in a way that hints at coaching impact.
Also not sure if you are interested in this part or not but for offense and defense but I'd really emphasize looking at % of shots taken from high percentage shot zones (inside or from 3) vs mid-range and look for signs of the system /execution getting smarter year to year to get at coaching impact. Coaches can't make the ball go in and have different talent levels for this skill but they should be able to influence where it goes up from. This is coaching intelligence, a counterpart to coaching effort.
That second point is a pretty good idea. I'm not sure if it's good enough to be the entire offensive and defensive aspects, but it definitely sounds like a factor I could include.
Back to top
View user's profile Send private message AIM Address
Jon Nichols
Joined: 18 Aug 2005
Posts: 370
PostPosted: Mon Jun 29, 2009 10:45 am Post subject: Reply with quote
With the help of Justin Kubatko, I was able to adjust each team's rebounding numbers based on their average height weighted by minutes played. You can find the new ratings at:
http://spreadsheets.google.com/ccc?key= ... sp20SQ3pig
Back to top
View user's profile Send private message AIM Address
Neil Paine
Joined: 13 Oct 2005
Posts: 774
Location: Atlanta, GA
PostPosted: Mon Jun 29, 2009 10:52 am Post subject: Reply with quote
Maybe you could also look at the players' previous career performance in each category (or even use something like our Simple Projection System) to establish an expected value for each team, and see if the team was better or worse than that expectation (the logic being that, given a roster with a certain "true talent" in each category, anything above or below that in actual team performance can be attributed to the coach).
Back to top
View user's profile Send private message Visit poster's website
Jon Nichols
Joined: 18 Aug 2005
Posts: 370
PostPosted: Mon Jun 29, 2009 11:23 am Post subject: Reply with quote
davis21wylie2121 wrote:
Maybe you could also look at the players' previous career performance in each category (or even use something like our Simple Projection System) to establish an expected value for each team, and see if the team was better or worse than that expectation (the logic being that, given a roster with a certain "true talent" in each category, anything above or below that in actual team performance can be attributed to the coach).
Very interesting. Pardon the ignorance, but do you have team projections using SPS published anywhere?
Back to top
View user's profile Send private message AIM Address
Neil Paine
Joined: 13 Oct 2005
Posts: 774
Location: Atlanta, GA
PostPosted: Mon Jun 29, 2009 11:37 am Post subject: Reply with quote
Sure, we have conventional boxscore stat projections for every player-season since 1980-81 here. Using that, you could set up a team's expectations for, say, offensive rebounding (sorry, we don't have charges drawn or loose-ball fouls, but I think you could apply the principles of the SPS to a player's past stats in those categories to form a decent projection), and see which coaches' teams exceed those expectations the most, etc.
Back to top
View user's profile Send private message Visit poster's website
Jon Nichols
Joined: 18 Aug 2005
Posts: 370
PostPosted: Mon Jun 29, 2009 12:11 pm Post subject: Reply with quote
davis21wylie2121 wrote:
Sure, we have conventional boxscore stat projections for every player-season since 1980-81 here. Using that, you could set up a team's expectations for, say, offensive rebounding (sorry, we don't have charges drawn or loose-ball fouls, but I think you could apply the principles of the SPS to a player's past stats in those categories to form a decent projection), and see which coaches' teams exceed those expectations the most, etc.
Would you happen to have team expectations? Right now I'm just trying to keep it simple with offensive and defensive ratings. I could calculate the projected ratings myself, although I'm not sure how to do that.
Back to top
View user's profile Send private message AIM Address
Crow
Joined: 20 Jan 2009
Posts: 821
PostPosted: Mon Jun 29, 2009 1:36 pm Post subject: Reply with quote
I was going to say that the % of high percentage shots taken and allowed might not be everything, it isn't just that simple but they are quite big pieces of the puzzle.
Then I thought to check net high percentage shots (% of inside shots or 3s on offense - defense) for the four conference finalists and it is more complicated. For the Cavs, Lakers and Nuggets they are actually negative regular season, giving up more high percentage shots than they take (-3 in each case). I guess it didn't hurt them (largely playing teams not optimized on this). But Orlando is way way different having a differential of +17%.
% of high percentage shots may not be the main answer for many teams but it appears to be a huge part of the Magics success- players, Stan Van Gundy's coaching impact and Otis Smith's intentional team design.
San Antonio is +5%. Houston +9. Boston +2.
New Orleans -5. Utah -4. Dallas -2. Portland +1.
Chicago -5. Philly -4.
Few teams have both parts of this formula and they may or may not think of them together but ultimately with players who play both sides of the ball that is the level where things should be summed.
Yeah you can go far without focusing on or achieving edge on this- if you are a great shooting team and a great defending team in spite of where you take and give up shots. But seems like running uphill to me.
Other notable coaches Larry Brown in Charlotte +3.
New York +10. Phoenix still at +9, still D'Antoni or D'Antoni style roster influenced. Michael Curry and the Pistons who succeeded in their glory with a lot of mid-range- or a lot of defense in spite of the mid-range- were at -7 last season. Jim O'Brien and the Pacers +4 and with Dunleavy probably would be higher.
Everything counts, % of high percentage shots isn't everything but I think it is useful to isolate and think about and act on.
I and others have said "3 pointing shooting and defense" is a successful formula. The expanded version of this is high % of high percentage shots and defense (including minimizing high percentage shots).
I don't have the % of high percentage shots the Magic took in the Finals or gave but Howard's shots were down by 3+ a game (offset partly by 2 more FTs) and the Lakers inside shots might have been more than usual for Magic opponents. If the Magic had been more the Magic on both sides of the 3 point line it might have been much tighter or in their favor. Against the Lakers they lost 3-4 %pts off the FG% for their own 3 pt game and lost 3-4 %pts off their 3 pt defense compared to their earlier playoff performance. Where you take and give shots matters but you still have to make them more than the other team of course.
Last edited by Crow on Tue Jun 30, 2009 2:14 am; edited 1 time in total
Back to top
View user's profile Send private message
Jon Nichols
Joined: 18 Aug 2005
Posts: 370
PostPosted: Mon Jun 29, 2009 3:17 pm Post subject: Reply with quote
Crow wrote:
I was going to say that the % of high percentage shots taken and allowed might not be everything, it isn't just that simple but they are quite big pieces of the puzzle.
Then I thought to check net high percentage shots (% of inside shots or 3s on offense - defense) for the four conference finalists and it is more complicated. For the Cavs, Lakers and Nuggets they are actually negative regular season, giving up more high percentage shots than they take (-3 in each case). I guess it didn't hurt them (largely playing teams not optimized on this). But Orlando is way way different having a differential of +17%.
% of high percentage shots may not be the main answer for many teams but it appears to be a huge part of the Magics success- players, Stan Van Gundy's coaching impact and Otis Smith's intentional team design.
San Antonio is +5%. Houston +9. Boston +2.
New Orleans -5. Utah -4. Dallas -2. Portland +1.
Chicago -5. Philly -4.
Few teams have both parts of this formula and they may or may not think of them together but ultimately with players who play both sides of the ball that is the level where things should be summed.
Yeah you can go far without focusing on or achieving edge on this- if you are a great shooting team and a great defending team in spite of where you take and give up shots. But seems like running uphill to me.
How many teams or team analysts have looked directly at net high percentage shots? Doesn't seem like many to me. If you looked at it, you'd want to act on it I'd think. This seems like something of value from an idea synthesizer. Didn't need regression or a PhD to do that.
Other notable coaches Larry Brown in Charlotte +3.
New York +10. Phoenix still at +9, still D'Antoni or D'Antoni style roster influenced. Michael Curry and the Pistons who succeeded in their glory with a lot of mid-range- or a lot of defense in spite of the mid-range- were at -7 last season. Jim O'Brien and the Pacers +4 and with Dunleavy probably would be higher.
Everything counts, % of high percentage shots isn't everything but I think it is useful to isolate and think about and act on.
I and others have said "3 pointing shooting and defense" is a successful formula. The expanded version of this is high % of high percentage shots and defense (including minimizing high percentage shots).
I don't have the % of high percentage shots the Magic took in the Finals or gave but Howard's shots were down by 3+ a game (offset partly by 2 more FTs) and the Lakers inside shots might have been more than usual for Magic opponents. If the Magic had been more the Magic on both sides of the 3 point line it might have been much tighter or in their favor. Against the Lakers they lost 3-4 %pts off the FG% for their own 3 pt game and lost 3-4 %pts off their 3 pt defense compared to their earlier playoff performance. Where you take and give shots matters but you still have to make them more than the other team of course.
I think that's a very interesting study and something I'd consider doing, possibly separate from the coaching ideas. It's obviously a reflection of coaching, though.
Back to top
View user's profile Send private message AIM Address
kjb
Joined: 03 Jan 2005
Posts: 865
Location: Washington, DC
PostPosted: Mon Jun 29, 2009 3:22 pm Post subject: Reply with quote
I haven't had a time to look at the blog posting in detail, but I immediately twitched on the underlying assumption that rebounding is largely about effort. Honestly, I kinda twitched on each of the assumptions. Why is taking a charge more of a sign of hustle than blocking a shot, or stealing the ball, or even hitting an open jumper?
I like the idea of using box score data for this kind of thing, but I'm dubious about the assumptions.
Jon Nichols
Joined: 18 Aug 2005
Posts: 370
PostPosted: Mon Jun 29, 2009 3:50 pm Post subject: Reply with quote
kjb wrote:
I haven't had a time to look at the blog posting in detail, but I immediately twitched on the underlying assumption that rebounding is largely about effort. Honestly, I kinda twitched on each of the assumptions. Why is taking a charge more of a sign of hustle than blocking a shot, or stealing the ball, or even hitting an open jumper?
I like the idea of using box score data for this kind of thing, but I'm dubious about the assumptions.
You may be right that these aren't the best indicators of hustle, but I chose them based on my own experience and observations, as well as how they tended to correlate with popular assumptions about which teams hustle the most. Obviously there are some flaws, such as Jeff Van Gundy and Pat Riley not faring very well, as well as Mike D'Antoni looking like he inspires no effort in his players. Unfortunately, these were the best measures I could think of, although I'd love to hear other suggestions.
Back to top
View user's profile Send private message AIM Address
Crow
Joined: 20 Jan 2009
Posts: 810
PostPosted: Mon Jun 29, 2009 4:19 pm Post subject: Reply with quote
Compared to the bottom 20 on % of high percentage shots given up on defense, the Magic give up over 10 points less per game from the high percentage zones regular season. That was 2/3rd better than the top 10 did on average and only San Antonio was better (by 1 pt). To beat the Magic the Lakers just had to be largely resistant to this effect, shot steering or limiting, and they were.
Crudely, Van Gundy and the Magic seem to emphasize the steering on offense and defense. Jackson and the Lakers more the execution of the final act on both sides of the ball. Tactical management / management philosophy.
Back to top
View user's profile Send private message
Crow
Joined: 20 Jan 2009
Posts: 810
PostPosted: Mon Jun 29, 2009 5:21 pm Post subject: Reply with quote
Other indicators of effort or lack of it- and more specifically probably coaching impact on effort- would include fastbreak and 2nd chance points given up. And layups.
Amount of unforced turnovers indicates player focus or lack thereof and maybe speaks to sufficiency of coaching inculcation of discipline / precision.
Back to top
View user's profile Send private message
Harold Almonte
Joined: 04 Aug 2006
Posts: 616
PostPosted: Mon Jun 29, 2009 7:16 pm Post subject: Reply with quote
I once read something about rating coaches based on wins above expected, but I don't remember the topic.
Back to top
View user's profile Send private message
Mike G
Joined: 14 Jan 2005
Posts: 3586
Location: Hendersonville, NC
PostPosted: Mon Jun 29, 2009 8:10 pm Post subject: Reply with quote
If you had a way of evaluating players, could you just look at their value before, during, and after a stint with a given coach?
One can get adjusted +/- for a few years now (I think). One could try Win Shares from basketball-reference.com, but that would reward success (WL%) : not necessarily bad, but would tend to promote coaches that are already viewed as successful; possibly undervaluing coaches with long-term rebuilding programs.
_________________
`
36% of all statistics are wrong
Back to top
View user's profile Send private message Send e-mail
Jon Nichols
Joined: 18 Aug 2005
Posts: 370
PostPosted: Mon Jun 29, 2009 10:32 pm Post subject: Reply with quote
Mike G wrote:
If you had a way of evaluating players, could you just look at their value before, during, and after a stint with a given coach?
One can get adjusted +/- for a few years now (I think). One could try Win Shares from basketball-reference.com, but that would reward success (WL%) : not necessarily bad, but would tend to promote coaches that are already viewed as successful; possibly undervaluing coaches with long-term rebuilding programs.
I believe that's what Berri did in his study on coaches, and he found no significant differences between coaches. I could try his method with a different rating system, although I'd probably end up with the same result.
Back to top
View user's profile Send private message AIM Address
Mike G
Joined: 14 Jan 2005
Posts: 3586
Location: Hendersonville, NC
PostPosted: Tue Jun 30, 2009 6:49 am Post subject: Reply with quote
Well, don't use a junk stat to express a player's value, and you won't get junk for your result.
Suppose a good coach should do 2 things:
1) Get the most out of the players he has: Offensive and Defensive system, lineup juggling, motivation, etc. This will be point differential, or pythagorean-expected wins, beyond what that group of players should be expected to create.
2) Win the close games: Execution in the clutch, outcoach the other coach. This will be the difference between the above (PythWins) and actual Wins.
Part of either component may be luck, but that should dampen out over a few years.
_________________
`
36% of all statistics are wrong
Back to top
View user's profile Send private message Send e-mail
jmethven
Joined: 16 May 2005
Posts: 51
PostPosted: Tue Jun 30, 2009 9:33 am Post subject: Reply with quote
Mike G wrote:
Well, don't use a junk stat to express a player's value, and you won't get junk for your result.
Yes, I think using something like adjusted +/- or perhaps better yet, offensive rating (less prone to noise) would have a good chance at yielding different results than Berri's study. These are both statistics that to some extent, reflect the role that a player is asked to fill. A good coach will know how to implement his personnel.
Back to top
View user's profile Send private message
Jon Nichols
Joined: 18 Aug 2005
Posts: 370
PostPosted: Tue Jun 30, 2009 9:50 am Post subject: Reply with quote
Mike G wrote:
Well, don't use a junk stat to express a player's value, and you won't get junk for your result.
Suppose a good coach should do 2 things:
1) Get the most out of the players he has: Offensive and Defensive system, lineup juggling, motivation, etc. This will be point differential, or pythagorean-expected wins, beyond what that group of players should be expected to create.
2) Win the close games: Execution in the clutch, outcoach the other coach. This will be the difference between the above (PythWins) and actual Wins.
Part of either component may be luck, but that should dampen out over a few years.
Good suggestions. I better get to work, with all these ideas being thrown around here!
Back to top
View user's profile Send private message AIM Address
Jon Nichols
Joined: 18 Aug 2005
Posts: 370
PostPosted: Wed Jul 01, 2009 9:43 am Post subject: Reply with quote
I continued with a simple step: looking at which coaches exceed their Pythagorean wins. Apparently this measure isn't very effective...
http://basketball-statistics.com/develo ... part2.html
Back to top
View user's profile Send private message AIM Address
kjb
Joined: 03 Jan 2005
Posts: 865
Location: Washington, DC
PostPosted: Wed Jul 01, 2009 10:05 am Post subject: Reply with quote
Jon: Minor suggestion for your blog -- don't center the body text. Centering makes it harder to read. My two cents worth.
Back to top
View user's profile Send private message AIM Address Yahoo Messenger
Jon Nichols
Joined: 18 Aug 2005
Posts: 370
PostPosted: Wed Jul 01, 2009 12:37 pm Post subject: Reply with quote
kjb wrote:
Jon: Minor suggestion for your blog -- don't center the body text. Centering makes it harder to read. My two cents worth.
That's been a problem that's been bugging me for quite a while. It seems to show up differently on every computer. When I view the pages, nothing is centered. And since I'm no technical expert, I'm having trouble figuring it out...
Which pages look centered to you?
Back to top
View user's profile Send private message AIM Address
kjb
Joined: 03 Jan 2005
Posts: 865
Location: Washington, DC
PostPosted: Wed Jul 01, 2009 12:48 pm Post subject: Reply with quote
Okay, either you're gaslighting me or my computer is. Smile This morning (and every other time I've visited your site), the articles have been centered. Just now, I went to your site, and NOTHING is centered!
Carry on.
Nothing to see here.
Back to top
View user's profile Send private message AIM Address Yahoo Messenger
Jon Nichols
Joined: 18 Aug 2005
Posts: 370
PostPosted: Wed Jul 01, 2009 12:53 pm Post subject: Reply with quote
kjb wrote:
Okay, either you're gaslighting me or my computer is. Smile This morning (and every other time I've visited your site), the articles have been centered. Just now, I went to your site, and NOTHING is centered!
Carry on.
Nothing to see here.
No, you're not crazy. I've seen my articles centered on other computers. I did just do something which I believe fixed my two most recent articles, though.
Back to top
View user's profile Send private message AIM Address
kjb
Joined: 03 Jan 2005
Posts: 865
Location: Washington, DC
PostPosted: Wed Jul 01, 2009 12:58 pm Post subject: Reply with quote
Okay, I'm not crazy. Just clicked on your profile for Blair and found it centered. There's probably an automatic setting someplace in your template that's doing it.
Neil Paine
Joined: 13 Oct 2005
Posts: 774
Location: Atlanta, GA
PostPosted: Thu Jul 02, 2009 8:29 am Post subject: Reply with quote
JNichols42887 wrote:
Would you happen to have team expectations? Right now I'm just trying to keep it simple with offensive and defensive ratings. I could calculate the projected ratings myself, although I'm not sure how to do that.
Yeah, that's probably something we'll publish at BBR at some point this summer -- when I get around to actually calculating them (it's an annoying process), I'll send you the data file.
Back to top
View user's profile Send private message Visit poster's website
Jon Nichols
Joined: 18 Aug 2005
Posts: 370
PostPosted: Thu Jul 02, 2009 9:24 am Post subject: Reply with quote
davis21wylie2121 wrote:
JNichols42887 wrote:
Would you happen to have team expectations? Right now I'm just trying to keep it simple with offensive and defensive ratings. I could calculate the projected ratings myself, although I'm not sure how to do that.
Yeah, that's probably something we'll publish at BBR at some point this summer -- when I get around to actually calculating them (it's an annoying process), I'll send you the data file.
Thanks! That would be awesome.
Back to top
View user's profile Send private message AIM Address
Harold Almonte
Joined: 04 Aug 2006
Posts: 616
PostPosted: Thu Jul 02, 2009 10:23 pm Post subject: Reply with quote
JNichols42887 wrote:
Quote:
I continued with a simple step: looking at which coaches exceed their Pythagorean wins. Apparently this measure isn't very effective...
Are you also adding the expected win% of every playoff series?
Back to top
View user's profile Send private message
Jon Nichols
Joined: 18 Aug 2005
Posts: 370
PostPosted: Fri Jul 03, 2009 12:17 pm Post subject: Reply with quote
Harold Almonte wrote:
JNichols42887 wrote:
Quote:
I continued with a simple step: looking at which coaches exceed their Pythagorean wins. Apparently this measure isn't very effective...
Are you also adding the expected win% of every playoff series?
No, my study focused strictly on the regular season.
Back to top
View user's profile Send private message AIM Address
Crow
Joined: 20 Jan 2009
Posts: 798
PostPosted: Sun Jul 05, 2009 3:37 pm Post subject: Reply with quote
Looking at which coaches exceed their regular season Pythagorean wins isn't a simple and sufficent test but it isn't that bad.
Expected win% of a coach's playoff record would add considerable value in my mind as would the difference between regular season and playoffs within a season and career, perhaps adjusted by expected player career curves. The difference between regular season and playoffs is still affected by player regular season to playoff performance ratios and hard to separate from coaches who often coach the same guys for a long time but I think you could develop even more to consider if not conclude clearly on coaching impact. or at least the portion of coaching impact that goes to match-up strategy and tactics and peak game management.
Back to top
View user's profile Send private message
ecumenopolis0
Joined: 15 Jul 2008
Posts: 22
Location: Houston
PostPosted: Sun Jul 05, 2009 4:33 pm Post subject: Reply with quote
the problem is, are we to assume that any irregularities not caused by the players are caused 100% by the coach? this seems unreasonable.
Back to top
View user's profile Send private message AIM Address
Jon Nichols
Joined: 18 Aug 2005
Posts: 370
PostPosted: Mon Jul 06, 2009 6:53 am Post subject: Reply with quote
ecumenopolis0 wrote:
the problem is, are we to assume that any irregularities not caused by the players are caused 100% by the coach? this seems unreasonable.
Agreed, and the results seem to confirm this. Clearly something else (luck, late game heroics, etc.) is at work.
Back to top
View user's profile Send private message AIM Address
Crow
Joined: 20 Jan 2009
Posts: 798
PostPosted: Fri Jul 10, 2009 3:54 am Post subject: Reply with quote
One possible test of game coaching would be to pit two coaches against each other on NBA Live using the exact same roster for both teams, assuming that is possible (and eliminating controller speed as an advantage if necessary or using another simulator).
You probably can't get Phil Jackson to face off against another top NBA coach- unkess they got paid big for it to market the game to an older crowd, which mght not be a bad dea- so then get two NBA assistants eager to show their game coaching acumen, or short of that high school coach rivals. Or get 100. Or open a test up and let anyone go for top score, head to head or against a computer opponent. Blind or with the full notes of the other game coaching moves available. This would isolate coach from player in the way reality with never allow. It would search for a max performance. It would demonstrate or or at least model coaching impact (and of course random results). You could alter the players and see who can get the most out of what kind of player or a specific mix. Or play that best of 7 and measure adjustments as well as initial strategy. Or play a 100 times and see whose average results are better.
And what if GMs had coaching candidates test against each other this way? Not likely but who would be game. who would back away or lose? I think you could gather some useful information this way.
And pit an average and / or top fan against an average or top NBA coach and see just how much better the pros really are at game coaching.
Or forget this whole approach and just take the idea of evaluating NBA coaches down to play by play level and really look at what they are directing and accomplishing.
Back to top
View user's profile Send private message
Recovered old threads- miscellaneous topics
Re: Recovered old threads- miscellaneous topics
dquinn1575
Joined: 03 Jun 2008
Posts: 12
PostPosted: Tue Jun 17, 2008 8:26 am Post subject: Five Man Units and Sample Size Reply with quote
I would like some insight into the sample size impact here:
I was thinking that a study that showed 5 man units expected points per possession versus actual points per possession would identify those units where a player did the "little things" that didn't show up in the box score. If I then identified the players who consistently turn up positive, I could see the impact of those players.
My concern as I looked at the 5 man unit numbers was sample size. Very few units play together even as much as 100 minutes. How valid is the sample and analyses for this data? It would appear that a lot of the data generated by a 5 man unit would be chance, and not reflective of the true talent of the group.
If I look at the most used 5 man unit by team, the most used unit (MUU) by team was only the best (minimum 100 minutes) for 9 of the NBA teams- and 1 was Miami, which only had 1 such unit (its second best unit, with 94 minutes was better).
This is saying that either most of the NBA coaches do not use their best line-up, or they intuitively know that the unit comes out on top due to sample size.
Now, I think my original study might still be valid. My concern is the impact of different with and without you studies using these small sample sizes.
Back to top
View user's profile Send private message
Mountain
Joined: 13 Mar 2007
Posts: 1527
PostPosted: Tue Jun 17, 2008 12:35 pm Post subject: Reply with quote
Coaches play "hands" / lineups and they want to win them but ultimately they want to win on net at the end. Winning your most used lineup would be nice but it is about winning enough hands, for enough chips, however- early, steady or in big runs or at the end. Some coaches play straight from the start, use a lot of their best talent / plays / tricks early and try to win big and as much as possible with most used / starting lineup. A "big 5" approach.
Other coaches (and GMs) play more of a bench game. They seem to emphasize chipping away in the middle a little more with later match-ups, slipping in productive plays and coaching tweaks subtly on the edges, as much as they can get away with without drawing a more effective response from the opponent. Not using as much of their best right away.
Of course the end game is often decisive, the final hands, often the biggest "pots" with the opponents having a lot more information about each other... but sometimes still guessing or making the other guy guess and guess wrong. Different ways to play the game (against different opponents- players and coaches).
Looking at performance of specific lineups has value and should continue to be done more and more deeply by serious basketball circles. How good the internal study is surely varies. From the outside many teams' lineup utilization look less than highly optimized. Small sample size is a real issue but as I've noted before coaches (at least those of the best teams with more slack to work with) could get more decent sized samples for lineups they rely on (especially in playoffs) with more tightly disciplined lineup management during the available 4000 or so minutes of regular season play aimed at gathering more reliable performance data about key lineups. As shaky as small sample lineup data is, coaching gut feelings about lineups seem shaky / error prone too. The best bet is the most / best lineup testing & analysis you can accomplish weighed along with coaching feel for the lineups and the opportunities and needs of specific moments in the course of many hand / possession game.
It is important to remember the context though, the effort to win the general war, not necessarily each and every battle.
Comparing expected points per possession of the players put on the court versus actual points per possession of the lineup as you suggest is one side by side to look at.
I am starting to look at the adjusted +/- of individual players and the adjusted performance of lineups. Seem like good approaches for understanding what works and how well at the 5 man lineup level and what changes to make to the lineup rotation "dance".
Back to top
View user's profile Send private message
Display posts from previous:
Re: Recovered old threads- miscellaneous topics
schtevie
Joined: 18 Apr 2005
Posts: 407
PostPosted: Thu Apr 01, 2010 11:22 am Post subject: Doc, do no harm.... Reply with quote
How can one best summarize the dimming of the Celtics title hopes this year? The malign effects of aging and a feckless bench? That is pretty much the conventional wisdom. But such a summary is at best misleading.
Though it is true that KG and Paul Pierce aren't the players they were two years ago, the fact of the matter is that the Celtics starting line-up is the league's best. Prior to last night's game, the Overall Rating on BasketballValue showed +13.99. (And thanks, yet again, Aaron for all the wonderful data.) So, why are the Celtics left to channeling their inner-Olajuwon for hopes of winning a title? It must be the bench, right?
Funny thing about the bench though. If you go again to BasketballValue and look at the average productivity of the line-ups when no starters are on the floor, you don't get a bad performance at all. You get strictly average performance. The minutes-weighted Overall Rating is -0.11 points per 100 possessions. And, by the way, these non-starter line-ups are better than two year's ago, by a significant amount (-0.11 vs. -1.42). (And, by the way, these line-ups log non-trivial minutes, 9.6% of the total this year. So, we are looking at a pretty robust measure.)
So, arithmetic then tells us that the culprit explaining the Celtics dimming playoff hopes must be the blended line-ups, those mixing starters and bench players. Indeed. This year, prior to last night's game, they had played 61% of the minutes, and logged in with a rating of +1.24. Not championship-caliber, by any means. By comparison, two year's ago, these blended line-ups bested their opponents by +9.28. (All these inferences based upon minute-weighted line-up data provided in BasketballValue.)
Why has there been such a precipitous decline in the aid that the starters have been able to provide to their benchmates? That is a very interesting question, but for now let the answer be: Who cares? There is a championship to be won.
The issue is whether the Celtics need to suffer the consequences of miserable, blended lineup play, and it seems to me the answer is: not so much, really.
Why is it - and here the observation pertains not just to the Celtics this year but to the league as a whole - that starters cannot use more or all of their minutes playing as the starting unit? It seems to me that at its root only the dead hand of tradition is the obstacle to serious, and I mean serious, platooning. Coaches make line-up changes first and foremost because.....coaches make lineup changes. (Wouldn't it be interesting to sit in on an NBA and NHL coach having a discussion on this point?) And the argument about making substitutions to create match-up advantages only makes sense if the assumption is that your strongest unit isn't on the floor. But that begs the question.
This year, similar to two year's ago, the Celtics starters played as a unit only 29% of the time. The other 35% (!) of the time that they were on the court (on average) they were in blended line-ups. That worked OK two years ago (but still was no net benefit) but this year it has proved disastrous. Why is it unreasonable to believe that keeping the starting unit in for an extra one third of the game wouldn't yield the same net 14 points per 100 possessions (less 1.23 as the opportunity cost)?
So, here's my "naive" remedy that I expect would elevate the Celtics to contenders instead of pretenders. Doc, at the start of each quarter, should put in his starting line-up then sit on his hands and not get up or say or do anything for the next nine plus minutes of game. At that point, send in the preferred substitutes for the last two plus minutes and tell them to leave it all out on the court. Trying to get play-wise and game-wise advantages by fiddling with line-ups has proven, this year, on average to be completely counterproductive. Let the aging stars do their thing, while they still can and they should be in the mix to the very end.
P.S. The numbers I presented above were based on data prior to last night's game. Now, it is only one game, but what do the revised totals at BasketballValue suggest about the effort against the Sonic Thunders? Well, the starting line-up last night, in a losing cause, raised their Overall Rating from 13.99 to 14.08 in 19.8 minutes of play. Backing things out (on a minute-weighted as opposed to the correct possession-weighted basis) this suggests that the starter's Overall Rating last night was....18.7. Is it not reasonable to infer that another 15 minutes or so of that productivity might have swung the game to the win column?
Back to top
View user's profile Send private message
back2newbelf
Joined: 21 Jun 2005
Posts: 250
PostPosted: Thu Apr 01, 2010 12:56 pm Post subject: Reply with quote
Pure non-starter lineups probably get used more against other non-starter lineups (or in situations where the game is already decided and nobody cares anymore) and therefore don't look so bad. To really compare mixed lineups with non starter lineups you'd have to adjust for opposing players.
Just because the bench as a unit is performing OK doesn't contradict the theory that the overall quality of bench play has regressed from two years ago. Maybe the players from back then were more comfortable in (multiple) roles they had to fill, while this years' bench guys can only play with each other.
Also, I really liked Leon Powe and I don't understand why they're giving so many of what could be Shelden Williams' minutes to Wallace and Davis
Back to top
View user's profile Send private message
schtevie
Joined: 18 Apr 2005
Posts: 407
PostPosted: Thu Apr 01, 2010 1:10 pm Post subject: Reply with quote
back2newbelf, you are missing the point. Of course, the expectation is that the various bench permutations that comprise the average have been used disproportionately against other non-starter lineups. But that also would be their stipulated role by my argument.
But besides that, my sense is that the Celtics bench plays more without starter help, relative to other team's. Consider this year's Lakers. Their non-starter lineups stink. Their average overall rating as of March 28 was -18.84! Not surprisingly, they have only been allowed on the court "unattended" for 2.8% of the minutes. And if the Lakers bench experience is closer to the average, then the Celtics bench must accordingly be playing against more starters.
The bottom line: the starting unit is really, really good and the pure bench units are fine for what should be asked of them, stop trying to be too clever by half and play to the obvious strength.
Back to top
View user's profile Send private message
DSMok1
Joined: 05 Aug 2009
Posts: 584
Location: Where the wind comes sweeping down the plains
PostPosted: Thu Apr 01, 2010 1:12 pm Post subject: Reply with quote
Adjusted +/-:
Rondo, Rajon - Allen, Ray - Pierce, Paul - Garnett, Kevin - Perkins, Kendrick (unit): 11.96 (1033 min)
Robinson, Nate - Daniels, Marquis - Finley, Michael - Davis, Glen - Wallace, Rasheed (unit): -0.39 (77.3 min)
The point actually is enhanced somewhat by the adjusted numbers.
Back to top
View user's profile Send private message Visit poster's website
Jon Nichols
Joined: 18 Aug 2005
Posts: 370
PostPosted: Thu Apr 01, 2010 2:09 pm Post subject: Reply with quote
You're ignoring foul trouble, though. If one starter picks up 2 early fouls, you have to use a mixed lineup. Unless of course you're willing to risk a third foul or you're willing to take the other 4 starters out to preserve that unit...
Back to top
View user's profile Send private message AIM Address
Crow
Joined: 20 Jan 2009
Posts: 796
PostPosted: Thu Apr 01, 2010 2:22 pm Post subject: Reply with quote
Doc Rivers used his strong starting lineup 3rd most in the league in 07-08, the most in '08-09 and 4th most so far in '09-10. He appears to understand the value of rolling with what works well as a complete unit far more than the average practice around the league. He even increased his starting lineup usage in the '08 playoffs to 35.6% of total playoff minutes compared to 27.1% in the regular season.
I have been and am still all for the main earlier suggestion of using an effective starting 5 to the max or nearer the max than they have been doing. I'd give them props for being well ahead of most other teams on this, but agree that how much time they give the stating lineup could well be a main deciding factor in how far they go this playoffs.
The Celtics do use an all sub lineup as their 6th most used lineup on the season. Since that includes Finley they have been using it about 6 minutes a game and that pro-rated for a full season would be by far the 2nd most used lineup. It seems Doc is doing at least that part of the suggested strategy more now. Though it has also performed close to neutral and is not better than the averages for blends or other all bench lineups.
I also see that 1 starter-4 sub lineups are also 7th, 9th and 14th most used and that is somewhat close to the suggested platoon philosophy.
I don't know if the amount the starting lineup has been used on average is going up for say the entire last month, but just looking at the average over the last three games it was about 20 minutes per game, or about a 50% increase over the season average of about 14 minutes. If they keep at 20 minutes per game in the playoffs that would be modestly ahead of the starting lineup usage in the '08 playoffs. And I wouldn't be surprised if they increased it at least a little more.
The truly important thing for the Celtics is play the starting lineup as much as possible.
For some other teams the situation isn't as polarized and there are teams that have better team results when they go past the starting unit.
Last edited by Crow on Thu Apr 01, 2010 7:40 pm; edited 21 times in total
Back to top
View user's profile Send private message
schtevie
Joined: 18 Apr 2005
Posts: 407
PostPosted: Thu Apr 01, 2010 2:23 pm Post subject: Reply with quote
Jon, I am not ignoring foul trouble, I just didn't mention it....because I think it is typically a complete, non-issue. Scratch that. It should be a non-issue.
Is there any evidence that fouls are serially correlated? And that the effect is large? What I see on the Celtics starting line-up is that the most foul-prone player (Kendrick Perkins) should expect to play 58 minutes per game before fouling out.
Back to top
View user's profile Send private message
Jon Nichols
Joined: 18 Aug 2005
Posts: 370
PostPosted: Thu Apr 01, 2010 2:30 pm Post subject: Reply with quote
schtevie wrote:
Jon, I am not ignoring foul trouble, I just didn't mention it....because I think it is typically a complete, non-issue. Scratch that. It should be a non-issue.
Is there any evidence that fouls are serially correlated? And that the effect is large? What I see on the Celtics starting line-up is that the most foul-prone player (Kendrick Perkins) should expect to play 58 minutes per game before fouling out.
I'm no expert on the foul issue, but I imagine it's more complicated than expected fouls per game. A Kendrick Perkins trying to avoid his third foul may be an entirely different player than a Kendrick Perkins playing without foul worries.
I think you're on to something, I'm just not sure it's that simple. Also, ironically, I was at the Celtics game last night and thought to myself how odd it was that the Celtics used an all-bench lineup so often. The other teams I've followed for many years rarely rely on five bench players at a time (of course, not every team has a rotation that is 10-deep). How does the Celtics' usage of an all-bench lineup compare to other teams?
Back to top
View user's profile Send private message AIM Address
schtevie
Joined: 18 Apr 2005
Posts: 407
PostPosted: Thu Apr 01, 2010 2:39 pm Post subject: Reply with quote
Jon, I am trying to write in a way that is a bit clearer than the truth to emphasize the point. Am I denying that having Ray Allen support a bench line-up when outside shooting ability would otherwise be sorely lacking might help? No. Well, not necessarily.
As for the fouling issue. I am not saying it is simple. I am saying that my sense is that there are gross errors committed on this point. It does a team no good to have their best player/lineups not on the court for the privilege of seeing 5 fouls or fewer for each starter in the box score. And to take your example of Perk not being the same player with two fouls early and give it a twist. I would argue that a key reason for Perk not playing to potential in that instance would be for fear of being irrationally yanked. If the coach didn't overvalue the foul, neither would he.
Back to top
View user's profile Send private message
BobboFitos
Joined: 21 Feb 2009
Posts: 186
Location: Cambridge, MA
PostPosted: Thu Apr 01, 2010 11:30 pm Post subject: Reply with quote
schtevie wrote:
I would argue that a key reason for Perk not playing to potential in that instance would be for fear of being irrationally yanked. If the coach didn't overvalue the foul, neither would he.
Good way of putting it. 100% agree with that, too.
_________________
-Rob
Back to top
View user's profile Send private message AIM Address
Neil Paine
Joined: 13 Oct 2005
Posts: 774
Location: Atlanta, GA
PostPosted: Fri Apr 02, 2010 8:58 am Post subject: Reply with quote
I think an interesting parallel for the foul issue is reliever usage in baseball. A common sabermetric criticism of managers is that they aren't deploying their best reliever (aka their closer) as efficiently as possible, in the highest-leverage situations, because they're arbitrarily saving him for the 9th inning. Now, sometimes the 9th inning is the highest-leverage situation... But a lot of times that situation comes in the 7th or the 8th, and in those instances you've put in a lesser reliever instead, trying build a bridge to the closer in a save situation that ends up never existing because the middle reliever loses the lead.
The same thing holds true for fouls. Guys get yanked or play conservatively when they pick up fouls early because the coach wants to save them for the closing sequence of the game; instead, he'll put in lesser players or instruct the player to play as a lesser version of himself to avoid the star fouling out before those high-leverage situations. But being outscored in the middle of the 2nd quarter with your best player on the bench with 3 fouls counts just the same on the scoreboard as if it came at the end of the game, right? Just like the manager is holding back his best reliever for a save situation that never comes, the NBA coach could be saving his best players for a late-game clutch situation that never comes because the game was lost in the 2nd quarter.
_________________
http://www.basketball-reference.com/blog/
Back to top
View user's profile Send private message Visit poster's website
Manchvegasbob
Joined: 03 Aug 2008
Posts: 52
PostPosted: Fri Apr 02, 2010 11:01 am Post subject: Reply with quote
Excellent thread (but I'm biased in anything Celtics)
I think the key here is knowing how much a detriment Rasheed Wallace has been to this team, particularly when he's married to playing on the perimeter. Like years past, this team would be one of the top 3-pt shooting teams if not for Wallace, who is as I refer as being Antoineque in his approach. Wallace clearly posts the worst Overall Rtg of any of the regulars, and is factor that can't be ignored when evaluating the effectiveness of the Celtics' rotations.
So . . . the blended unit that gets the most time and really hurts the team is the Wallace for Perkins substitution. And with this rotation, Wallace is allowed to be on the perimeter where he is useless as a shooter and fails to assist the team in getting any ORs/2nd chance points.
Now for that "all bench" team that includes Finley along with NRob-Daniels-Davis and Wallace, that is a recent rotation due to the acquisition of Finley. Wallace has noticeably been playing more responsibly with that unit and assumes the post more with Davis moved to a mid-range position on the offensive end. So Wallace is forced to behave in that rotation.
FYI - my lament on Rasheed Wallace is further elaborated here http://celticsstufflive.com/csl-home/ja ... y-kool-aid, but I see Wallace changing his tune with his play of late (since Finley's arrival).
Does that explanation make sense to you all?
Back to top
View user's profile Send private message Visit poster's website
Crow
Joined: 20 Jan 2009
Posts: 796
PostPosted: Fri Apr 02, 2010 1:42 pm Post subject: Reply with quote
Raw +/- has the team doing far better with Williams-Wallace than Davis-Wallace but the latter is still slightly positive.
I've only looked at it briefly but I'd start with the following lineup set and then see what adjustments are necessary in general or for a particular opponent:
Play very heavy (especially in second half)
Rondo- R Allen - Pierce - Garnett- Perkins
Make sure to use
Rondo- T Allen -R Allen- Garnett- Perkins
Rondo- R Allen- Daniels- Garnett- Wallace
Probably use
Robinson- Daniels- Finley- Davis- Wallace
Main next choices, as appropriate
Robinson - R Allen - Daniels- Williams- Wallace
Rondo- T Allen- Pierce- Garnett- Perkins
Robinson - T Allen- R Allen- Davis- Wallace
Robinson- T Allen- Daniels- Williams- Davis
Robinson- T Allen- Daniels - Davis- Wallace
Rondo-Daniels-Pierce-Williams-Wallace
Or maybe find versions of these that add back one starter, particularly Rondo (if Robinson is not on the right track) or Pierce.
Back to top
View user's profile Send private message
mtamada
Joined: 28 Jan 2005
Posts: 375
PostPosted: Fri Apr 02, 2010 6:51 pm Post subject: Reply with quote
Manchvegasbob wrote:
this team would be one of the top 3-pt shooting teams if not for Wallace, who is as I refer as being Antoineque in his approach.
A good heckle might be to call him "Antoine" Wallace. I can envision 76er fans, or even disgruntled Celtic fans, chanting "Annn twawnn, Annn twawnn" the way they used to chant "Darr ryll" at Darryl Strawberry.
It wasn't that long ago that Rasheed Wallace seemed to be generally underrated by sportswriters and the fans and maybe front offices. Is it just the effects of age or is there something about the Boston situation that ill-suits him?
Back to top
View user's profile Send private message
jdpapa3
Joined: 22 Jan 2010
Posts: 1
PostPosted: Sun Apr 04, 2010 11:39 pm Post subject: Reply with quote
Stinks that after this post the next two games featured one of the starting five getting in foul trouble early and causing havoc to the rotation. All I could think of was this thread both times.
chtevie
Joined: 18 Apr 2005
Posts: 414
PostPosted: Wed Apr 07, 2010 2:06 pm Post subject: Reply with quote
Having pondered the lineup data at BasketballValue at some greater length, it seems a little unfair, in a certain sense, to have been picking on Doc for under-utilizing his starting lineup. From the standpoint of the league as a whole, the Celtics have been way out in front over the past three years, no other team's starting lineup minutes coming even close to that of the Cs. That aside, poring over the data really does underscore the sense that there are real and large foregone opportunities in coaches not being early adapters and aggressively platooning their starting lineups. The situation reminds me of the non-use of the 3 point shot, circa the early 80s. Then as now, clear evidence existed/exists that significant competitive gains were/are attainable by simple changes that were/are completely within the control of each team (well, for the early adapters, anyway), the only apparent impediment being tradition. Just as it would have been crazy talk in the early 80s to suggest that around 20% of FGAs should be 3s (even the ABA 4% of FGAs was too lofty a goal for the first seven years) so it might seem to be to advocate for a platooning of the starting lineup for the vast majority of starter minutes.
Recognizing the Oliverian rejoinder to allegations of suboptimal NBA decision-making, that coaches and management really tend to know what they are doing, it seems worthwhile to present the argument at some greater length. To begin, let's entertain a contextual, leading question. Over the course of an NBA season, what should be the playing time of the average, non-starting lineup? As in what would be the ideal length (barring injuries or trades which cut potential game time) in terms of maximizing its efficiency on both sides of the court? A fundamental basketball belief is that 'chemistry' matters. And what is 'chemistry' if not a unit achieving its maximum potential, which ultimately can only be acquired through practice and repetition. So, over the course of a season, to realize potential, would you want each unit to play the equivalent of a half a game, a whole game, perhaps two or three? Well, you know where this is going.
Taking the Celtics data for this season as being roughly representative of the league as a whole, by my count, as of April 2, there were 284 lineups deployed in 3572 minutes of game time. Of these, 1047 were taken by the starters. This leaves an average playing time of each non-starter lineup of less than 9 minutes, spread out over an unknown average of games. And the median line-up duration? A little under 4 minutes! And these numbers, plus or minus not much, are the experience of the entire NBA.
Said another way, what is the rational basis for having a team consisting of 284 teams? Especially when 283 are known (or should be known) to be not nearly as good as the first one.
Jon brought up one factor that I dismissed, the substitution for early fouls. As noted, this would be a rational basis for diminishing starting lineup time if one believed that foul rates are serially correllated and relatedly if one believed that all game time was not equal. As far as I know, there is no compelling evidence for either proposition, but I would welcome any references on these matters. But this aside, even if one were to grant a coach a little discretion in this area, this factor simply cannot begin to explain the lineup explosion observed in NBA basketball.
What explains the multitude, I have assigned to the dead hand of tradition. Come game time, coaches are expected to coach, and, besides yelling at the refs and calling out plays, that means making substitutions. If you are going to be making $4 million a year, you can't just sit there, can you? And arguably - and this is conjecture - the league-wide growth in stats-awareness is adding fuel to the flames. Call it the Fallacy of Synergy. If you pore through the various types of data and perceive a potential opponent weakness such that when facing opponent's Lineup X that substituting Player Y in Lineup Z might get you a bit of a boost to your offense or defense, well, then there is justification for creating yet another lineup. The opposing coach's reaction aside - as well as the fact that such action will also have unforeseen consequences - is there any reason to believe that there are net benefits overall to such fine-grained decision-making that they merit the necessary reduction in starting line-up minutes as well as the diminution of greater ('chemistry'-inducing) playing time for preexisting blended lineups?
Let me address this through the prism of the Celtics' performance since 2007-08. In the championship year, the Overall Rating of the starting lineup, blended lineups, and bench only lineups were: 19.47, 9.28, and -1.42. Last year, the starters got much worse as did their bench, but the blended lineups were relatively excellent: 11.10, 8.64, and -6.65. And this year, we have as a year on change, better starters, much worse blended lineups, and much better pure bench performance: 13.99 (as of a couple of games ago), 1.24, and -0.11. See the pattern? Exactly. Did Doc go from being a decent blender of talent, to a supah-genius, to an incompetent?
In the proliferation of lineups what we have is a small sample size theater festival and the subscription comes at a rather high price. Better to stick with the headliners.
Back to top
View user's profile Send private message
Crow
Joined: 20 Jan 2009
Posts: 825
PostPosted: Wed Apr 07, 2010 4:14 pm Post subject: Reply with quote
In the 07-08 regular season the 10 most used Celtics lineups accounted for a bit over 60% of total team minutes. In the playoffs it went to over 70%. It might still make sense to alter that mix, increase concentration even further for the very best lineups but that is fairly concentrated.
In the 08-09 regular season the Magic's 10 most used lineups accounted for a bit over 50% and the Lakers' a bit over 60%. Again in the playoffs the concentration increased to over 60% and over 70% respectively.
In the regular season, beyond the use of core lineups, Coaches can
1) match-up in unusual ways as they deem appropriate to try to win games (especially in light of fouls, injuries and other performance issues),
or 2) prospect for lineups that might become core,
or 3) give minutes to and gather more data on lineups that they will very likely use in the playoffs and try to help in choosing among them.
You probably should prioritize these strategically in advance and as you go along and try to do as much as you can on 2 and 3 along with winning "enough" or the max possible.
If you add the Lakers next ten most used lineups the total for their top 20 most used in the '09 playoffs was around 85%. In the 08-09 regular season Jackson used 218 lineups. That was less than most Coaches but would it have helped a bit more in getting ready for the playoffs to spend some additional time given to the bottom 198 lineups instead on the top 20 relied upon heavily in the playoffs? I'd think so. How much was actually prospecting for core lineups? I don't know but I'd guess a good deal of it was not done for that purpose. But they won a lot of games and learned some things about lineups along the way.
It is a long ride and Coaches do what they want and have to in order to get thru the regular season. But, after that, they better know what lineups they want to use in the playoffs, how much and when, and will be judged by the results.
Jackson's team won the title, so he did enough and enough right. 3/4ths of the lineups he made top 20 in the playoffs were positive on raw +/-. 2/3rds were positive on Adjusted +/-, but with big and very big error terms for the estimates. That is pretty good. I'd say there was still room to be even better prepared and perhaps make even a better set of choices though.
But that thought is even stronger and more appropriate for the teams that came up short. Of Orlando's 20 most used lineups in the '09 playoffs only 60% were positive on raw +/- and less than half were estimated positive on Adjusted +/-. When you lose the Finals it has its affect, of course. But none of the top 3 lineups used were positive on raw or Adjusted +/- across a set of 4 series and that is a bit disappointing. Overall they were good enough for second place... but there was probably some room for improvement on lineup choices and other things for them... and for everyone below.
Back to top
View user's profile Send private message
schtevie
Joined: 18 Apr 2005
Posts: 414
PostPosted: Thu Apr 08, 2010 1:05 pm Post subject: Reply with quote
Crow, what I read is a restatement of conventional wisdom ("It is a long ride and Coaches do what they want...", "Jackson's team won the title, so he did enough and enough right.", "I'd say there was still room to be even better.") that is fundamentally beside the point.
The point is that, as a general rule, talent in the NBA is apparent and well-recognized and concentrated in the starting units. Despite this, such units are grossly underplayed in the NBA. This is true in the regular season. This is true in the post-season. And there are large, competitive gains to be had by the team(s) that first recognize this fact.
The point is not that improvements cannot be made be fiddling at the existing margin. The point is that the optimal margin is waaaaaaaay off.
Just as it was not incorrect to say 30 years ago that a team would be better by getting rid of a couple of contested long range twos and substitute them with more open threes. It would have been far more correct and profitable for one or more teams to have recognized that they could have substituted a huge chunk of their two point offense and become much more competitive.
And I should note that playing starting lineups longer is obviously a much simpler task than fundamentally changing offenses to swap two for threes. Playbooks needed to change. Players needed to realize that acquiring a different skill set was rational and would be rewarded. Progress inched forward, little by little, but it took a quarter century, and no team saw the opportunity for what it was and capitalized on it.
I think you inadvertently identify an impediment to change however. If Phil Freakin' Jackson (and the $12 million salary that ratifies his as best practice) isn't doing it, it can't be right. Right? He couldn't have represented better in the 2007-08 playoffs if he had played Bryant/Fisher/Gasol/Odom/Radmanovic for more than 1/3 or the time. Right?
Who will lead the revolution and recognize the BasketballValue? I wonder...
Back to top
View user's profile Send private message
Crow
Joined: 20 Jan 2009
Posts: 825
PostPosted: Thu Apr 08, 2010 1:29 pm Post subject: Reply with quote
Our posts have some overlap but you made your presentation and I chose a different level of study and posture. Because coaches still regularly use a lot of lineups in the playoffs, I suggested a focus on the performance of the set of the 10-20 most-used lineups. The most used lineup for a team is quite important but is rarely reaches 40% of total minutes and often is quite a bit less. I've agreed all along that a strong unit should be used a lot and that even a team like the Celtics could probably be better if they played their top unit even more this season.
Theoretically the main lineup could get 32 or 36 minutes per game under a strict unit substitution plan. I'd be for such a revolution with the right lineup on the right team but don't have much expectation of getting one that big. Instead I'd push for now to see teams get their main lineup to at least 20 minutes at least in the playoffs and maybe a few will go to 24-28, if not right away, some day. And while they do that (and even after), I do think the next 5, 10 or 20 lineups matter and so I dealt with that. Some lineups should be clearly elevated above the remaining tail end of lineups.
Phil Jackson only used his main lineup about 30% of the time last playoffs and I said they'd probably also have been even better if he had used it more. He did use the top 10 lineups over 70% and the top 20 over 85% of the total time though. Apples and Oranges to you, but I thought it was at least worth looking at what he is actually doing.
If I bent back too much to conventional thinking for your tastes, I hear your view.
You are one of the few also to show public interest in the topic, present data and make arguments in support of higher concentration, for the very best lineup. The separation of results for blends and pure non-starter lineups and the proposal for serious platooning broke new and worthwhile ground.
I've been pushing here and there for greater lineup concentration for several years. Sometimes I've tried pitching it harder, this time I did take some of the heat off it. Sometimes I hear I went too hard, I guess this time not hard enough for you. Whatever the temperature readers will glean and think as they chose. Of course at least a few of the teams appear to have worked on the topic and may recommend or encourage increased lineup concentration, more than the average of their colleagues.
There are some reasons or frictions that help explain why lineup concentration isn't higher than it is. it has been covered before- Injuries, for sure. Fear of fouls or reaction to guys missing 3 or 4 shots in a row can cut both ways- understandable concern but maybe overdone. Coaches use substitutions for coaching input / impact because it is probably their most powerful tool. They may overdo it, but so is the other guy and maybe they feel their hand is forced. While it may be hard to break out of that cycle, I think they probably need to be more selective.
Bottom-line, I'd push lineup concentration up a lot (continuing until you get negative returns) for a top strong lineup and the top set of strong or at least neutral lineups. If I broadened the focus out to top 10-20 lineups it was to try to find a middle ground between tradition and change. Maximizing the very best lineup should come first, then, after a coach does that as much as he is going to, maximize the next ones at least reasonably vigorously.
How things change in the NBA in general is a good thing to consider and review. When the 3 pointer was instituted 2 teams jumped out with more than double the league average attempts that first season. One pulled back closer to the fold the next season and the league average as a whole pulled down too, almost 20%. In year 3 the highest teams had throttled their enthusiasm back a bit and were only 50% above the league average and the league average was still not back to the first year figure. It wasn't 'til year 6 that the league average exceeded what it was in year 1. But from then on, the evolution gained steam and eventually a long-term revolutionary change in the game could be said to have occurred.
I haven't assembled the data on reduction in the mid-range shooting yet but it is probably really early in that saga. The story with regard to lineup concentration is probably early too. Moving fairly slowly. There is certainly room for it is go further, with more teams. Whether you want a revolution on this, I'm guessing at league level it will end up probably mostly looking like an evolution.
If there is going to be a leading wedge on lineup concentration, it will have to include a coach or a few all for the revolution. Pushing them probably will only yield so much. Need a coach racing to maximize concentration because it works, because he wants to and can get credit for it and what can go along with that.
I don't know the level of lineup concentration back in earlier eras (with shorter benches and perhaps less talent), but in the 82 games data era the 04-05 Pistons was probably the peak team for top lineup concentration... at about 17 minutes per game regular season. This is one benchmark.
This season there are 4 teams with lineups over 1000 minutes- relatively impressive but still a threshold of just above 12 minutes per game. 4 is more than last year or the year before.
"Who will lead the revolution and recognize the BasketballValue? I wonder..."
Clever and I assume leading phrasing. The Grizzlies probably will end up the current era leader for highest minutes per game for a lineup at close to 20 minutes.
As I said I don't know the longer range data and trends on lineup concentration immediately so this view comes from a fairly narrow band of time, but lineup concentration might be moving forward some.
Some places seem more about specific players and combos and others do fine with a "system" and less lineup concentration, so again context matters as well. Broadening the focus to a top set of lineups was in part to recognize that. It would be less critical to key on one lineup if you have several good ones. Of course it is hard to be sure which lineup is really good off a small sample.
Even for the top 12 most used lineups in the league only three look really strong on Adjusted +/-, then 4-5 look "probably" good or at least neutral and the of the weakest 4-5 there is even less solid upon which to say they are even neutral. Those first three teams (and Boston is one of them) are the best candidates to go hard towards the max on concentration. The other teams in the 12 and some of the teams below might want to stay somewhat open-minded and have work underway on a select set of other options, a farm system for testing and development for possible "call-ups" for more minutes.
I guess there might be stability benefits of a big minute lineup even when it is only near neutral, especially with a young team. Maybe with a multi-year commitment lineups can improve significantly. But you have to judge when to turn the ship.
And some coaches try to win the war more with the bench.
There are a lot of factors and angles and ways to look at the topic. I haven't previously addressed trying to keep an overly long NBA bench ready or happy or thinking about or planning for the future, but I've probably hashed thru enough.
If you identify a strong lineup, yeah, get the coach to play them as much as you can and reap the rewards. And then deal with the rest of the time.
Back to top
View user's profile Send private message
MartyW
Joined: 31 Mar 2009
Posts: 5
PostPosted: Fri Apr 16, 2010 11:30 am Post subject: Reply with quote
There seems to be one argument against platooning not really touched upon
schtevie wrote:
what would be the ideal length (barring injuries or trades which cut potential game time) in terms of maximizing its efficiency on both sides of the court?
Injuries don't just limit the amount of court time shared in season, but a late season injury could lead to a lineup with virtually zero familiarity going into the playoffs.
Of course this doesn't negate the idea, and if one is making the title one's ultimate goal, then it might make sense to go "all in" and gamble that injuries won't happen. But it should probably be taken into account.
Joined: 18 Apr 2005
Posts: 407
PostPosted: Thu Apr 01, 2010 11:22 am Post subject: Doc, do no harm.... Reply with quote
How can one best summarize the dimming of the Celtics title hopes this year? The malign effects of aging and a feckless bench? That is pretty much the conventional wisdom. But such a summary is at best misleading.
Though it is true that KG and Paul Pierce aren't the players they were two years ago, the fact of the matter is that the Celtics starting line-up is the league's best. Prior to last night's game, the Overall Rating on BasketballValue showed +13.99. (And thanks, yet again, Aaron for all the wonderful data.) So, why are the Celtics left to channeling their inner-Olajuwon for hopes of winning a title? It must be the bench, right?
Funny thing about the bench though. If you go again to BasketballValue and look at the average productivity of the line-ups when no starters are on the floor, you don't get a bad performance at all. You get strictly average performance. The minutes-weighted Overall Rating is -0.11 points per 100 possessions. And, by the way, these non-starter line-ups are better than two year's ago, by a significant amount (-0.11 vs. -1.42). (And, by the way, these line-ups log non-trivial minutes, 9.6% of the total this year. So, we are looking at a pretty robust measure.)
So, arithmetic then tells us that the culprit explaining the Celtics dimming playoff hopes must be the blended line-ups, those mixing starters and bench players. Indeed. This year, prior to last night's game, they had played 61% of the minutes, and logged in with a rating of +1.24. Not championship-caliber, by any means. By comparison, two year's ago, these blended line-ups bested their opponents by +9.28. (All these inferences based upon minute-weighted line-up data provided in BasketballValue.)
Why has there been such a precipitous decline in the aid that the starters have been able to provide to their benchmates? That is a very interesting question, but for now let the answer be: Who cares? There is a championship to be won.
The issue is whether the Celtics need to suffer the consequences of miserable, blended lineup play, and it seems to me the answer is: not so much, really.
Why is it - and here the observation pertains not just to the Celtics this year but to the league as a whole - that starters cannot use more or all of their minutes playing as the starting unit? It seems to me that at its root only the dead hand of tradition is the obstacle to serious, and I mean serious, platooning. Coaches make line-up changes first and foremost because.....coaches make lineup changes. (Wouldn't it be interesting to sit in on an NBA and NHL coach having a discussion on this point?) And the argument about making substitutions to create match-up advantages only makes sense if the assumption is that your strongest unit isn't on the floor. But that begs the question.
This year, similar to two year's ago, the Celtics starters played as a unit only 29% of the time. The other 35% (!) of the time that they were on the court (on average) they were in blended line-ups. That worked OK two years ago (but still was no net benefit) but this year it has proved disastrous. Why is it unreasonable to believe that keeping the starting unit in for an extra one third of the game wouldn't yield the same net 14 points per 100 possessions (less 1.23 as the opportunity cost)?
So, here's my "naive" remedy that I expect would elevate the Celtics to contenders instead of pretenders. Doc, at the start of each quarter, should put in his starting line-up then sit on his hands and not get up or say or do anything for the next nine plus minutes of game. At that point, send in the preferred substitutes for the last two plus minutes and tell them to leave it all out on the court. Trying to get play-wise and game-wise advantages by fiddling with line-ups has proven, this year, on average to be completely counterproductive. Let the aging stars do their thing, while they still can and they should be in the mix to the very end.
P.S. The numbers I presented above were based on data prior to last night's game. Now, it is only one game, but what do the revised totals at BasketballValue suggest about the effort against the Sonic Thunders? Well, the starting line-up last night, in a losing cause, raised their Overall Rating from 13.99 to 14.08 in 19.8 minutes of play. Backing things out (on a minute-weighted as opposed to the correct possession-weighted basis) this suggests that the starter's Overall Rating last night was....18.7. Is it not reasonable to infer that another 15 minutes or so of that productivity might have swung the game to the win column?
Back to top
View user's profile Send private message
back2newbelf
Joined: 21 Jun 2005
Posts: 250
PostPosted: Thu Apr 01, 2010 12:56 pm Post subject: Reply with quote
Pure non-starter lineups probably get used more against other non-starter lineups (or in situations where the game is already decided and nobody cares anymore) and therefore don't look so bad. To really compare mixed lineups with non starter lineups you'd have to adjust for opposing players.
Just because the bench as a unit is performing OK doesn't contradict the theory that the overall quality of bench play has regressed from two years ago. Maybe the players from back then were more comfortable in (multiple) roles they had to fill, while this years' bench guys can only play with each other.
Also, I really liked Leon Powe and I don't understand why they're giving so many of what could be Shelden Williams' minutes to Wallace and Davis
Back to top
View user's profile Send private message
schtevie
Joined: 18 Apr 2005
Posts: 407
PostPosted: Thu Apr 01, 2010 1:10 pm Post subject: Reply with quote
back2newbelf, you are missing the point. Of course, the expectation is that the various bench permutations that comprise the average have been used disproportionately against other non-starter lineups. But that also would be their stipulated role by my argument.
But besides that, my sense is that the Celtics bench plays more without starter help, relative to other team's. Consider this year's Lakers. Their non-starter lineups stink. Their average overall rating as of March 28 was -18.84! Not surprisingly, they have only been allowed on the court "unattended" for 2.8% of the minutes. And if the Lakers bench experience is closer to the average, then the Celtics bench must accordingly be playing against more starters.
The bottom line: the starting unit is really, really good and the pure bench units are fine for what should be asked of them, stop trying to be too clever by half and play to the obvious strength.
Back to top
View user's profile Send private message
DSMok1
Joined: 05 Aug 2009
Posts: 584
Location: Where the wind comes sweeping down the plains
PostPosted: Thu Apr 01, 2010 1:12 pm Post subject: Reply with quote
Adjusted +/-:
Rondo, Rajon - Allen, Ray - Pierce, Paul - Garnett, Kevin - Perkins, Kendrick (unit): 11.96 (1033 min)
Robinson, Nate - Daniels, Marquis - Finley, Michael - Davis, Glen - Wallace, Rasheed (unit): -0.39 (77.3 min)
The point actually is enhanced somewhat by the adjusted numbers.
Back to top
View user's profile Send private message Visit poster's website
Jon Nichols
Joined: 18 Aug 2005
Posts: 370
PostPosted: Thu Apr 01, 2010 2:09 pm Post subject: Reply with quote
You're ignoring foul trouble, though. If one starter picks up 2 early fouls, you have to use a mixed lineup. Unless of course you're willing to risk a third foul or you're willing to take the other 4 starters out to preserve that unit...
Back to top
View user's profile Send private message AIM Address
Crow
Joined: 20 Jan 2009
Posts: 796
PostPosted: Thu Apr 01, 2010 2:22 pm Post subject: Reply with quote
Doc Rivers used his strong starting lineup 3rd most in the league in 07-08, the most in '08-09 and 4th most so far in '09-10. He appears to understand the value of rolling with what works well as a complete unit far more than the average practice around the league. He even increased his starting lineup usage in the '08 playoffs to 35.6% of total playoff minutes compared to 27.1% in the regular season.
I have been and am still all for the main earlier suggestion of using an effective starting 5 to the max or nearer the max than they have been doing. I'd give them props for being well ahead of most other teams on this, but agree that how much time they give the stating lineup could well be a main deciding factor in how far they go this playoffs.
The Celtics do use an all sub lineup as their 6th most used lineup on the season. Since that includes Finley they have been using it about 6 minutes a game and that pro-rated for a full season would be by far the 2nd most used lineup. It seems Doc is doing at least that part of the suggested strategy more now. Though it has also performed close to neutral and is not better than the averages for blends or other all bench lineups.
I also see that 1 starter-4 sub lineups are also 7th, 9th and 14th most used and that is somewhat close to the suggested platoon philosophy.
I don't know if the amount the starting lineup has been used on average is going up for say the entire last month, but just looking at the average over the last three games it was about 20 minutes per game, or about a 50% increase over the season average of about 14 minutes. If they keep at 20 minutes per game in the playoffs that would be modestly ahead of the starting lineup usage in the '08 playoffs. And I wouldn't be surprised if they increased it at least a little more.
The truly important thing for the Celtics is play the starting lineup as much as possible.
For some other teams the situation isn't as polarized and there are teams that have better team results when they go past the starting unit.
Last edited by Crow on Thu Apr 01, 2010 7:40 pm; edited 21 times in total
Back to top
View user's profile Send private message
schtevie
Joined: 18 Apr 2005
Posts: 407
PostPosted: Thu Apr 01, 2010 2:23 pm Post subject: Reply with quote
Jon, I am not ignoring foul trouble, I just didn't mention it....because I think it is typically a complete, non-issue. Scratch that. It should be a non-issue.
Is there any evidence that fouls are serially correlated? And that the effect is large? What I see on the Celtics starting line-up is that the most foul-prone player (Kendrick Perkins) should expect to play 58 minutes per game before fouling out.
Back to top
View user's profile Send private message
Jon Nichols
Joined: 18 Aug 2005
Posts: 370
PostPosted: Thu Apr 01, 2010 2:30 pm Post subject: Reply with quote
schtevie wrote:
Jon, I am not ignoring foul trouble, I just didn't mention it....because I think it is typically a complete, non-issue. Scratch that. It should be a non-issue.
Is there any evidence that fouls are serially correlated? And that the effect is large? What I see on the Celtics starting line-up is that the most foul-prone player (Kendrick Perkins) should expect to play 58 minutes per game before fouling out.
I'm no expert on the foul issue, but I imagine it's more complicated than expected fouls per game. A Kendrick Perkins trying to avoid his third foul may be an entirely different player than a Kendrick Perkins playing without foul worries.
I think you're on to something, I'm just not sure it's that simple. Also, ironically, I was at the Celtics game last night and thought to myself how odd it was that the Celtics used an all-bench lineup so often. The other teams I've followed for many years rarely rely on five bench players at a time (of course, not every team has a rotation that is 10-deep). How does the Celtics' usage of an all-bench lineup compare to other teams?
Back to top
View user's profile Send private message AIM Address
schtevie
Joined: 18 Apr 2005
Posts: 407
PostPosted: Thu Apr 01, 2010 2:39 pm Post subject: Reply with quote
Jon, I am trying to write in a way that is a bit clearer than the truth to emphasize the point. Am I denying that having Ray Allen support a bench line-up when outside shooting ability would otherwise be sorely lacking might help? No. Well, not necessarily.
As for the fouling issue. I am not saying it is simple. I am saying that my sense is that there are gross errors committed on this point. It does a team no good to have their best player/lineups not on the court for the privilege of seeing 5 fouls or fewer for each starter in the box score. And to take your example of Perk not being the same player with two fouls early and give it a twist. I would argue that a key reason for Perk not playing to potential in that instance would be for fear of being irrationally yanked. If the coach didn't overvalue the foul, neither would he.
Back to top
View user's profile Send private message
BobboFitos
Joined: 21 Feb 2009
Posts: 186
Location: Cambridge, MA
PostPosted: Thu Apr 01, 2010 11:30 pm Post subject: Reply with quote
schtevie wrote:
I would argue that a key reason for Perk not playing to potential in that instance would be for fear of being irrationally yanked. If the coach didn't overvalue the foul, neither would he.
Good way of putting it. 100% agree with that, too.
_________________
-Rob
Back to top
View user's profile Send private message AIM Address
Neil Paine
Joined: 13 Oct 2005
Posts: 774
Location: Atlanta, GA
PostPosted: Fri Apr 02, 2010 8:58 am Post subject: Reply with quote
I think an interesting parallel for the foul issue is reliever usage in baseball. A common sabermetric criticism of managers is that they aren't deploying their best reliever (aka their closer) as efficiently as possible, in the highest-leverage situations, because they're arbitrarily saving him for the 9th inning. Now, sometimes the 9th inning is the highest-leverage situation... But a lot of times that situation comes in the 7th or the 8th, and in those instances you've put in a lesser reliever instead, trying build a bridge to the closer in a save situation that ends up never existing because the middle reliever loses the lead.
The same thing holds true for fouls. Guys get yanked or play conservatively when they pick up fouls early because the coach wants to save them for the closing sequence of the game; instead, he'll put in lesser players or instruct the player to play as a lesser version of himself to avoid the star fouling out before those high-leverage situations. But being outscored in the middle of the 2nd quarter with your best player on the bench with 3 fouls counts just the same on the scoreboard as if it came at the end of the game, right? Just like the manager is holding back his best reliever for a save situation that never comes, the NBA coach could be saving his best players for a late-game clutch situation that never comes because the game was lost in the 2nd quarter.
_________________
http://www.basketball-reference.com/blog/
Back to top
View user's profile Send private message Visit poster's website
Manchvegasbob
Joined: 03 Aug 2008
Posts: 52
PostPosted: Fri Apr 02, 2010 11:01 am Post subject: Reply with quote
Excellent thread (but I'm biased in anything Celtics)
I think the key here is knowing how much a detriment Rasheed Wallace has been to this team, particularly when he's married to playing on the perimeter. Like years past, this team would be one of the top 3-pt shooting teams if not for Wallace, who is as I refer as being Antoineque in his approach. Wallace clearly posts the worst Overall Rtg of any of the regulars, and is factor that can't be ignored when evaluating the effectiveness of the Celtics' rotations.
So . . . the blended unit that gets the most time and really hurts the team is the Wallace for Perkins substitution. And with this rotation, Wallace is allowed to be on the perimeter where he is useless as a shooter and fails to assist the team in getting any ORs/2nd chance points.
Now for that "all bench" team that includes Finley along with NRob-Daniels-Davis and Wallace, that is a recent rotation due to the acquisition of Finley. Wallace has noticeably been playing more responsibly with that unit and assumes the post more with Davis moved to a mid-range position on the offensive end. So Wallace is forced to behave in that rotation.
FYI - my lament on Rasheed Wallace is further elaborated here http://celticsstufflive.com/csl-home/ja ... y-kool-aid, but I see Wallace changing his tune with his play of late (since Finley's arrival).
Does that explanation make sense to you all?
Back to top
View user's profile Send private message Visit poster's website
Crow
Joined: 20 Jan 2009
Posts: 796
PostPosted: Fri Apr 02, 2010 1:42 pm Post subject: Reply with quote
Raw +/- has the team doing far better with Williams-Wallace than Davis-Wallace but the latter is still slightly positive.
I've only looked at it briefly but I'd start with the following lineup set and then see what adjustments are necessary in general or for a particular opponent:
Play very heavy (especially in second half)
Rondo- R Allen - Pierce - Garnett- Perkins
Make sure to use
Rondo- T Allen -R Allen- Garnett- Perkins
Rondo- R Allen- Daniels- Garnett- Wallace
Probably use
Robinson- Daniels- Finley- Davis- Wallace
Main next choices, as appropriate
Robinson - R Allen - Daniels- Williams- Wallace
Rondo- T Allen- Pierce- Garnett- Perkins
Robinson - T Allen- R Allen- Davis- Wallace
Robinson- T Allen- Daniels- Williams- Davis
Robinson- T Allen- Daniels - Davis- Wallace
Rondo-Daniels-Pierce-Williams-Wallace
Or maybe find versions of these that add back one starter, particularly Rondo (if Robinson is not on the right track) or Pierce.
Back to top
View user's profile Send private message
mtamada
Joined: 28 Jan 2005
Posts: 375
PostPosted: Fri Apr 02, 2010 6:51 pm Post subject: Reply with quote
Manchvegasbob wrote:
this team would be one of the top 3-pt shooting teams if not for Wallace, who is as I refer as being Antoineque in his approach.
A good heckle might be to call him "Antoine" Wallace. I can envision 76er fans, or even disgruntled Celtic fans, chanting "Annn twawnn, Annn twawnn" the way they used to chant "Darr ryll" at Darryl Strawberry.
It wasn't that long ago that Rasheed Wallace seemed to be generally underrated by sportswriters and the fans and maybe front offices. Is it just the effects of age or is there something about the Boston situation that ill-suits him?
Back to top
View user's profile Send private message
jdpapa3
Joined: 22 Jan 2010
Posts: 1
PostPosted: Sun Apr 04, 2010 11:39 pm Post subject: Reply with quote
Stinks that after this post the next two games featured one of the starting five getting in foul trouble early and causing havoc to the rotation. All I could think of was this thread both times.
chtevie
Joined: 18 Apr 2005
Posts: 414
PostPosted: Wed Apr 07, 2010 2:06 pm Post subject: Reply with quote
Having pondered the lineup data at BasketballValue at some greater length, it seems a little unfair, in a certain sense, to have been picking on Doc for under-utilizing his starting lineup. From the standpoint of the league as a whole, the Celtics have been way out in front over the past three years, no other team's starting lineup minutes coming even close to that of the Cs. That aside, poring over the data really does underscore the sense that there are real and large foregone opportunities in coaches not being early adapters and aggressively platooning their starting lineups. The situation reminds me of the non-use of the 3 point shot, circa the early 80s. Then as now, clear evidence existed/exists that significant competitive gains were/are attainable by simple changes that were/are completely within the control of each team (well, for the early adapters, anyway), the only apparent impediment being tradition. Just as it would have been crazy talk in the early 80s to suggest that around 20% of FGAs should be 3s (even the ABA 4% of FGAs was too lofty a goal for the first seven years) so it might seem to be to advocate for a platooning of the starting lineup for the vast majority of starter minutes.
Recognizing the Oliverian rejoinder to allegations of suboptimal NBA decision-making, that coaches and management really tend to know what they are doing, it seems worthwhile to present the argument at some greater length. To begin, let's entertain a contextual, leading question. Over the course of an NBA season, what should be the playing time of the average, non-starting lineup? As in what would be the ideal length (barring injuries or trades which cut potential game time) in terms of maximizing its efficiency on both sides of the court? A fundamental basketball belief is that 'chemistry' matters. And what is 'chemistry' if not a unit achieving its maximum potential, which ultimately can only be acquired through practice and repetition. So, over the course of a season, to realize potential, would you want each unit to play the equivalent of a half a game, a whole game, perhaps two or three? Well, you know where this is going.
Taking the Celtics data for this season as being roughly representative of the league as a whole, by my count, as of April 2, there were 284 lineups deployed in 3572 minutes of game time. Of these, 1047 were taken by the starters. This leaves an average playing time of each non-starter lineup of less than 9 minutes, spread out over an unknown average of games. And the median line-up duration? A little under 4 minutes! And these numbers, plus or minus not much, are the experience of the entire NBA.
Said another way, what is the rational basis for having a team consisting of 284 teams? Especially when 283 are known (or should be known) to be not nearly as good as the first one.
Jon brought up one factor that I dismissed, the substitution for early fouls. As noted, this would be a rational basis for diminishing starting lineup time if one believed that foul rates are serially correllated and relatedly if one believed that all game time was not equal. As far as I know, there is no compelling evidence for either proposition, but I would welcome any references on these matters. But this aside, even if one were to grant a coach a little discretion in this area, this factor simply cannot begin to explain the lineup explosion observed in NBA basketball.
What explains the multitude, I have assigned to the dead hand of tradition. Come game time, coaches are expected to coach, and, besides yelling at the refs and calling out plays, that means making substitutions. If you are going to be making $4 million a year, you can't just sit there, can you? And arguably - and this is conjecture - the league-wide growth in stats-awareness is adding fuel to the flames. Call it the Fallacy of Synergy. If you pore through the various types of data and perceive a potential opponent weakness such that when facing opponent's Lineup X that substituting Player Y in Lineup Z might get you a bit of a boost to your offense or defense, well, then there is justification for creating yet another lineup. The opposing coach's reaction aside - as well as the fact that such action will also have unforeseen consequences - is there any reason to believe that there are net benefits overall to such fine-grained decision-making that they merit the necessary reduction in starting line-up minutes as well as the diminution of greater ('chemistry'-inducing) playing time for preexisting blended lineups?
Let me address this through the prism of the Celtics' performance since 2007-08. In the championship year, the Overall Rating of the starting lineup, blended lineups, and bench only lineups were: 19.47, 9.28, and -1.42. Last year, the starters got much worse as did their bench, but the blended lineups were relatively excellent: 11.10, 8.64, and -6.65. And this year, we have as a year on change, better starters, much worse blended lineups, and much better pure bench performance: 13.99 (as of a couple of games ago), 1.24, and -0.11. See the pattern? Exactly. Did Doc go from being a decent blender of talent, to a supah-genius, to an incompetent?
In the proliferation of lineups what we have is a small sample size theater festival and the subscription comes at a rather high price. Better to stick with the headliners.
Back to top
View user's profile Send private message
Crow
Joined: 20 Jan 2009
Posts: 825
PostPosted: Wed Apr 07, 2010 4:14 pm Post subject: Reply with quote
In the 07-08 regular season the 10 most used Celtics lineups accounted for a bit over 60% of total team minutes. In the playoffs it went to over 70%. It might still make sense to alter that mix, increase concentration even further for the very best lineups but that is fairly concentrated.
In the 08-09 regular season the Magic's 10 most used lineups accounted for a bit over 50% and the Lakers' a bit over 60%. Again in the playoffs the concentration increased to over 60% and over 70% respectively.
In the regular season, beyond the use of core lineups, Coaches can
1) match-up in unusual ways as they deem appropriate to try to win games (especially in light of fouls, injuries and other performance issues),
or 2) prospect for lineups that might become core,
or 3) give minutes to and gather more data on lineups that they will very likely use in the playoffs and try to help in choosing among them.
You probably should prioritize these strategically in advance and as you go along and try to do as much as you can on 2 and 3 along with winning "enough" or the max possible.
If you add the Lakers next ten most used lineups the total for their top 20 most used in the '09 playoffs was around 85%. In the 08-09 regular season Jackson used 218 lineups. That was less than most Coaches but would it have helped a bit more in getting ready for the playoffs to spend some additional time given to the bottom 198 lineups instead on the top 20 relied upon heavily in the playoffs? I'd think so. How much was actually prospecting for core lineups? I don't know but I'd guess a good deal of it was not done for that purpose. But they won a lot of games and learned some things about lineups along the way.
It is a long ride and Coaches do what they want and have to in order to get thru the regular season. But, after that, they better know what lineups they want to use in the playoffs, how much and when, and will be judged by the results.
Jackson's team won the title, so he did enough and enough right. 3/4ths of the lineups he made top 20 in the playoffs were positive on raw +/-. 2/3rds were positive on Adjusted +/-, but with big and very big error terms for the estimates. That is pretty good. I'd say there was still room to be even better prepared and perhaps make even a better set of choices though.
But that thought is even stronger and more appropriate for the teams that came up short. Of Orlando's 20 most used lineups in the '09 playoffs only 60% were positive on raw +/- and less than half were estimated positive on Adjusted +/-. When you lose the Finals it has its affect, of course. But none of the top 3 lineups used were positive on raw or Adjusted +/- across a set of 4 series and that is a bit disappointing. Overall they were good enough for second place... but there was probably some room for improvement on lineup choices and other things for them... and for everyone below.
Back to top
View user's profile Send private message
schtevie
Joined: 18 Apr 2005
Posts: 414
PostPosted: Thu Apr 08, 2010 1:05 pm Post subject: Reply with quote
Crow, what I read is a restatement of conventional wisdom ("It is a long ride and Coaches do what they want...", "Jackson's team won the title, so he did enough and enough right.", "I'd say there was still room to be even better.") that is fundamentally beside the point.
The point is that, as a general rule, talent in the NBA is apparent and well-recognized and concentrated in the starting units. Despite this, such units are grossly underplayed in the NBA. This is true in the regular season. This is true in the post-season. And there are large, competitive gains to be had by the team(s) that first recognize this fact.
The point is not that improvements cannot be made be fiddling at the existing margin. The point is that the optimal margin is waaaaaaaay off.
Just as it was not incorrect to say 30 years ago that a team would be better by getting rid of a couple of contested long range twos and substitute them with more open threes. It would have been far more correct and profitable for one or more teams to have recognized that they could have substituted a huge chunk of their two point offense and become much more competitive.
And I should note that playing starting lineups longer is obviously a much simpler task than fundamentally changing offenses to swap two for threes. Playbooks needed to change. Players needed to realize that acquiring a different skill set was rational and would be rewarded. Progress inched forward, little by little, but it took a quarter century, and no team saw the opportunity for what it was and capitalized on it.
I think you inadvertently identify an impediment to change however. If Phil Freakin' Jackson (and the $12 million salary that ratifies his as best practice) isn't doing it, it can't be right. Right? He couldn't have represented better in the 2007-08 playoffs if he had played Bryant/Fisher/Gasol/Odom/Radmanovic for more than 1/3 or the time. Right?
Who will lead the revolution and recognize the BasketballValue? I wonder...
Back to top
View user's profile Send private message
Crow
Joined: 20 Jan 2009
Posts: 825
PostPosted: Thu Apr 08, 2010 1:29 pm Post subject: Reply with quote
Our posts have some overlap but you made your presentation and I chose a different level of study and posture. Because coaches still regularly use a lot of lineups in the playoffs, I suggested a focus on the performance of the set of the 10-20 most-used lineups. The most used lineup for a team is quite important but is rarely reaches 40% of total minutes and often is quite a bit less. I've agreed all along that a strong unit should be used a lot and that even a team like the Celtics could probably be better if they played their top unit even more this season.
Theoretically the main lineup could get 32 or 36 minutes per game under a strict unit substitution plan. I'd be for such a revolution with the right lineup on the right team but don't have much expectation of getting one that big. Instead I'd push for now to see teams get their main lineup to at least 20 minutes at least in the playoffs and maybe a few will go to 24-28, if not right away, some day. And while they do that (and even after), I do think the next 5, 10 or 20 lineups matter and so I dealt with that. Some lineups should be clearly elevated above the remaining tail end of lineups.
Phil Jackson only used his main lineup about 30% of the time last playoffs and I said they'd probably also have been even better if he had used it more. He did use the top 10 lineups over 70% and the top 20 over 85% of the total time though. Apples and Oranges to you, but I thought it was at least worth looking at what he is actually doing.
If I bent back too much to conventional thinking for your tastes, I hear your view.
You are one of the few also to show public interest in the topic, present data and make arguments in support of higher concentration, for the very best lineup. The separation of results for blends and pure non-starter lineups and the proposal for serious platooning broke new and worthwhile ground.
I've been pushing here and there for greater lineup concentration for several years. Sometimes I've tried pitching it harder, this time I did take some of the heat off it. Sometimes I hear I went too hard, I guess this time not hard enough for you. Whatever the temperature readers will glean and think as they chose. Of course at least a few of the teams appear to have worked on the topic and may recommend or encourage increased lineup concentration, more than the average of their colleagues.
There are some reasons or frictions that help explain why lineup concentration isn't higher than it is. it has been covered before- Injuries, for sure. Fear of fouls or reaction to guys missing 3 or 4 shots in a row can cut both ways- understandable concern but maybe overdone. Coaches use substitutions for coaching input / impact because it is probably their most powerful tool. They may overdo it, but so is the other guy and maybe they feel their hand is forced. While it may be hard to break out of that cycle, I think they probably need to be more selective.
Bottom-line, I'd push lineup concentration up a lot (continuing until you get negative returns) for a top strong lineup and the top set of strong or at least neutral lineups. If I broadened the focus out to top 10-20 lineups it was to try to find a middle ground between tradition and change. Maximizing the very best lineup should come first, then, after a coach does that as much as he is going to, maximize the next ones at least reasonably vigorously.
How things change in the NBA in general is a good thing to consider and review. When the 3 pointer was instituted 2 teams jumped out with more than double the league average attempts that first season. One pulled back closer to the fold the next season and the league average as a whole pulled down too, almost 20%. In year 3 the highest teams had throttled their enthusiasm back a bit and were only 50% above the league average and the league average was still not back to the first year figure. It wasn't 'til year 6 that the league average exceeded what it was in year 1. But from then on, the evolution gained steam and eventually a long-term revolutionary change in the game could be said to have occurred.
I haven't assembled the data on reduction in the mid-range shooting yet but it is probably really early in that saga. The story with regard to lineup concentration is probably early too. Moving fairly slowly. There is certainly room for it is go further, with more teams. Whether you want a revolution on this, I'm guessing at league level it will end up probably mostly looking like an evolution.
If there is going to be a leading wedge on lineup concentration, it will have to include a coach or a few all for the revolution. Pushing them probably will only yield so much. Need a coach racing to maximize concentration because it works, because he wants to and can get credit for it and what can go along with that.
I don't know the level of lineup concentration back in earlier eras (with shorter benches and perhaps less talent), but in the 82 games data era the 04-05 Pistons was probably the peak team for top lineup concentration... at about 17 minutes per game regular season. This is one benchmark.
This season there are 4 teams with lineups over 1000 minutes- relatively impressive but still a threshold of just above 12 minutes per game. 4 is more than last year or the year before.
"Who will lead the revolution and recognize the BasketballValue? I wonder..."
Clever and I assume leading phrasing. The Grizzlies probably will end up the current era leader for highest minutes per game for a lineup at close to 20 minutes.
As I said I don't know the longer range data and trends on lineup concentration immediately so this view comes from a fairly narrow band of time, but lineup concentration might be moving forward some.
Some places seem more about specific players and combos and others do fine with a "system" and less lineup concentration, so again context matters as well. Broadening the focus to a top set of lineups was in part to recognize that. It would be less critical to key on one lineup if you have several good ones. Of course it is hard to be sure which lineup is really good off a small sample.
Even for the top 12 most used lineups in the league only three look really strong on Adjusted +/-, then 4-5 look "probably" good or at least neutral and the of the weakest 4-5 there is even less solid upon which to say they are even neutral. Those first three teams (and Boston is one of them) are the best candidates to go hard towards the max on concentration. The other teams in the 12 and some of the teams below might want to stay somewhat open-minded and have work underway on a select set of other options, a farm system for testing and development for possible "call-ups" for more minutes.
I guess there might be stability benefits of a big minute lineup even when it is only near neutral, especially with a young team. Maybe with a multi-year commitment lineups can improve significantly. But you have to judge when to turn the ship.
And some coaches try to win the war more with the bench.
There are a lot of factors and angles and ways to look at the topic. I haven't previously addressed trying to keep an overly long NBA bench ready or happy or thinking about or planning for the future, but I've probably hashed thru enough.
If you identify a strong lineup, yeah, get the coach to play them as much as you can and reap the rewards. And then deal with the rest of the time.
Back to top
View user's profile Send private message
MartyW
Joined: 31 Mar 2009
Posts: 5
PostPosted: Fri Apr 16, 2010 11:30 am Post subject: Reply with quote
There seems to be one argument against platooning not really touched upon
schtevie wrote:
what would be the ideal length (barring injuries or trades which cut potential game time) in terms of maximizing its efficiency on both sides of the court?
Injuries don't just limit the amount of court time shared in season, but a late season injury could lead to a lineup with virtually zero familiarity going into the playoffs.
Of course this doesn't negate the idea, and if one is making the title one's ultimate goal, then it might make sense to go "all in" and gamble that injuries won't happen. But it should probably be taken into account.
Re: Recovered old threads- miscellaneous topics
RocketsFan
Joined: 23 Oct 2005
Posts: 404
PostPosted: Sun Jul 30, 2006 6:49 pm Post subject: What have we learned? Reply with quote
I know several of you work for NBA teams, so you don't have to share your secrets. But I am interested in what everyone thinks are some of the core principles to apbrmetrics. For example, one of the first things every budding apbrmetrician is taught is that a team's offense and defense should be measured in points scored and allowed per possession, not per game. Per game averages can be deceiving at the player level too. A player may show no improvement, but his statistics will rise because of an increase in playing time. Offensive rebounding has been shown to be more important than defensive rebounding, although both are skills that need to be learned to improve one's game on each end of the floor.
As I recall, DeanO did a chapter on some of the fundamental principles necessary to create a winning team in Basketball on Paper. I don't have the book with me, though.
I just came up with the few mentioned off the top of my head; I'm sure there are many others. I would just like to see a record of what we have learned in sharing our thoughts here at the apbrmetrics community.
Back to top
View user's profile Send private message Yahoo Messenger
Mike G
Joined: 14 Jan 2005
Posts: 3597
Location: Hendersonville, NC
PostPosted: Sun Jul 30, 2006 8:07 pm Post subject: Reply with quote
Actually, I don't remember being shown that OReb are more important than DReb. I've seen several arguments and correlations promoting the idea, but I remain unconvinced.
Gauging offense and defense by Pts/Poss is another one I don't entirely subscribe to. There's also a team's style of play, strategy shifts and matchup exploitation (during or between playoff series, for example) that may 'look like' a team has become better or worse on offense or defense. But what the coach is after is really optimal point-differential.
There's continuing debate on whether per-minute averages can be scaled up to per-40-minutes, etc. The concept of Efficiency has been defined in every way imaginable. Lately a number of us have been wrangling with the various ways of ascribing wins contributed by individuals. The utility of arriving at a consensus may always be secondary to the value of diversity in our methods.
_________________
`
36% of all statistics are wrong
Back to top
View user's profile Send private message Send e-mail
Kevin Pelton
Site Admin
Joined: 30 Dec 2004
Posts: 979
Location: Seattle
PostPosted: Mon Jul 31, 2006 12:03 am Post subject: Reply with quote
I hate to sound facetious by answering simply, but ... context matters.
That's far and away at the top of my list, because it affects most everything anyone does.
Back to top
View user's profile Send private message Send e-mail Visit poster's website
HoopStudies
Joined: 30 Dec 2004
Posts: 705
Location: Near Philadelphia, PA
PostPosted: Mon Jul 31, 2006 2:56 pm Post subject: Re: What have we learned? Reply with quote
RocketsFan wrote:
I just came up with the few mentioned off the top of my head; I'm sure there are many others. I would just like to see a record of what we have learned in sharing our thoughts here at the apbrmetrics community.
First, I will say that the development of APBRmetrics - or quantitative sports analysis in general - is becoming even more important than I thought. The field is wide open, developing at a fast rate. The concepts in sports are often relevant to many other disciplines, as well. I am now finding work in economics, finance, political science, biology, and ecology that is particularly ready for some of the techniques from sports analysis because sports analysis is inherently multidisciplinary. I am starting to understand biology a lot better now through some of the tools of sports analysis; translating the inferences into traditional biology language is a current challenge but making progress. The competitive nature of life and life systems is incredibly robust, making adaptations as NBA teams do. I wish I had more time to go into that field.
More relevant to your question, there are many principles from Basketball on Paper that I use nearly constantly as I work. Those summarized in the last chapter of the book are relevant and very useful. I can't talk about much of the work I've done on the job, which has sometimes modified (nothing significantly) and amended things in that chapter. But I did want to point this out:
Coaching: I screwed this up in BoP. The best coaches are worth more than 10 wins per season over an average coach. If you just reread the chapter and think while looking at the tables (I divided by years coached when I shouldn't have), you'll realize it. I've done significant other work to confirm this.
_________________
Dean Oliver
Author, Basketball on Paper
The postings are my own & don't necess represent positions, strategies or opinions of employers.
Back to top
View user's profile Send private message Visit poster's website
Mark
Joined: 20 Aug 2005
Posts: 807
PostPosted: Mon Jul 31, 2006 4:06 pm Post subject: Reply with quote
I agree on coach impacts having potential to be large.
Perhaps we need other scores on them besides the team measures of w-l, point differential, off rtg, def rtg, differential, pace, etc. Performance in close games and after timeouts are a start at looking for more but not the end of it.
Perhaps year to year player quality development scores? Based any which way. Much credit /blame should go to player but some to coach too I think.
5 man lineup role definement, integration and success?
Rotation optimalization?
Number of times fall 10 points down? and record recovering?
Number of times coming from 6-8 down with 4-5 minutes to go?
Record in April (what the season of coaching has led to and achieved)? Compared to November as a ratio? More attention to record in playoffs?
Number of 50 win season or homecourt advantage in first/second round; number of trips or ratio for career of getting beyond second round? If not succeeding beyond the second round is really all essentiallly "failure" to have high success, the goal, and not that much different, then emphasize getting beyond it as the only real success measure? Coaches who can occasionally or frequently have great success may be different than those who could be decent to pretty good all the time but not as often acheiving more than that.
Recognizing players who arent working and getting them traded? Getting better ones? Trying to make draft pick fit for present need? Obviously hard to score size of their input on these.
Coaches who attract or repel free agent players to some degree beyond what money, playing time, city does? Is this small or big enough to deserve more attention? Winning coaches often attract obviously not how about the cases of Eddie Jordan (modest success but partly attracted Arenas) or just to suggest one possible the other way Fratello ? (is turning off B Jackson more his own feelings not liking his situation or is there a big case to be made of not listening /alienating / not keeping in the fold as much as possible?)
Back to top
View user's profile Send private message
alphamale
Joined: 03 May 2006
Posts: 67
PostPosted: Mon Jul 31, 2006 9:16 pm Post subject: Reply with quote
A peice of philosophy that I always use is this:
In order to be a truly effective apbrmetrician, one must not totally ignore the qualitative approaches. Should we leave qualitativeness to the journalists and sports writers? maybe. Can phenomenological and constructionistic viewpoints get in the way of objectivity? maybe. But I think we all agree that unless we are god, we cannot look at anything with 100 percent objectivity and that qualitative approaches can add more valuable insights and variables from overlooked perspectives, and supplement quantitative inference.
Re: Recovered old threads- miscellaneous topics
deepak
Joined: 26 Apr 2006
Posts: 665
PostPosted: Tue Dec 22, 2009 1:53 pm Post subject: Wages of Wins: Rockets, Ariza, Comment on Usg vs Eff Reply with quote
http://dberri.wordpress.com/2009/12/22/ ... -surprise/
As noted by Kevin Pelton, the Rockets this year serve as an interesting experiment in Usage vs Efficiency. Before the season, amongst the rotation regulars only Battier ever averaged more than 13 ppg for a season (he did so in his rookie year). Some felt that the lack of adept one-on-one scorers would hinder the Rockets offensive attack. So far, against arguably the most difficult schedule in the league, the Rockets are in the top half in offensive efficiency.
Do these results serve to validate the preseason analysis of the Rockets from Wages of Wins? Does it help support the theory that scoring is overrated? Is the "Usg vs Eff" relationship perhaps overstated, even by the general APBRMetrics community? He does acknowledge the case of Trevor Ariza, which would seem to bolster the argument that great usage will tend to drive down efficiency. But, in the grand scheme, he writes:
Quote:
The performance of the Rockets this season demonstrates an aspect of basketball performance often noted in this forum. Basketball players – relative to what we see in baseball and football – are very consistent over time. For the most part, the productivity of the players the Rockets are employing this season is not much different from what we saw last year. Yes, the loss of the team’s primary scorers has forced other players to take shots. In general, though, the increase in shot attempts hasn’t reduced each player’s effectiveness.
Also, from his research of decades worth of data:
Quote:
When you look at players from 1977-78 to 2007-08 (the sample includes over 5,000 season observations) you see that there is a link between a change in the number of shots he takes and his shooting efficiency. But the impact is quite small. Here is what we say in our next book: “…imagine a player who takes 16.3 shots per 48 minutes and has an adjusted field goal percentage of 48.4% (these are the league average marks). If that player increased his shots per 48 minutes to 25.3 (a two standard deviation increase), his adjusted field goal percentage would be expected to decline to 47.1%.
My question is: how can we predict whether increase in usage will result in a big decrease in efficiency, a marginal decrease in efficiency, or perhaps improved efficiency? We have models, apparently, that suggest in general there is a drop, but can we get more precise (in an automatic way, not via scouting) by considering details specific to the player? For example, is there a smart way to determine from the data that Landry would not become much less efficient with more touches, while Ariza would?
Some thoughts on this:
* If the player has a history of playing efficiently with increased usage (e.g., maybe there was an injury that forced him into that role for a few weeks), that should be taken into account.
* Considering the % of FGM that were unassisted will separate players who are adept at creating their own shot. Perhaps such players are less likely to see a dip in their efficiency.
* How does a player's efficiency change based on the "combined usage" of the other 4 players he's sharing the floor with? A different take on Dean Oliver's "skill curves", but I think that could be interesting to look at.
Back to top
View user's profile Send private message
Kevin Pelton
Site Admin
Joined: 30 Dec 2004
Posts: 979
Location: Seattle
PostPosted: Tue Dec 22, 2009 2:05 pm Post subject: Reply with quote
Good question. I was thinking about this the other day when I was writing about Ron Artest in L.A. He and Ariza have basically traded offensive roles, which is interesting. While that's pummeled Ariza's efficiency, Artest hasn't benefited all that much. In a strange way, this is actually a testament to Artest's value, because it demonstrates that his usage curve is fairly flat, so he can take on a lot more possessions fairly easily.
Back to top
View user's profile Send private message Send e-mail Visit poster's website
Ryan J. Parker
Joined: 23 Mar 2007
Posts: 711
Location: Raleigh, NC
PostPosted: Tue Dec 22, 2009 2:06 pm Post subject: Reply with quote
Do you happen to have a link to the methodology he used in his research? I've found that usage is a better indicator than % of shots taken when measuring the relationship between usage and efficiency. Also, I'd prefer an analysis in terms of possessions instead of minutes.
As for your question, there are models that allow us to estimate how players differ from other players. Take my post on age, usage, and 3FG% as an example. The model behind this allows for player specific aging curves and usage lines. For example, when you compare Ray Allen's graph to Robert Horry's graph, you see that the impact of Allen's increase in usage is different to Horry's.
So the answer to your question is yes, it can be done. I think it would be interesting to study more than just 3FG%, and also it would be good to consider how player type/skill set impacts this relationship as well.
_________________
I am a basketball geek.
Back to top
View user's profile Send private message Visit poster's website
Ryan J. Parker
Joined: 23 Mar 2007
Posts: 711
Location: Raleigh, NC
PostPosted: Tue Dec 22, 2009 2:12 pm Post subject: Reply with quote
Kevin, have you used more than just the change between last year and this year to come to that conclusion about Artest? I haven't taken an in depth look at his career, but here is Artest's graphic the model produces (blue=10% usage, black=20% usage, red=30% usage):
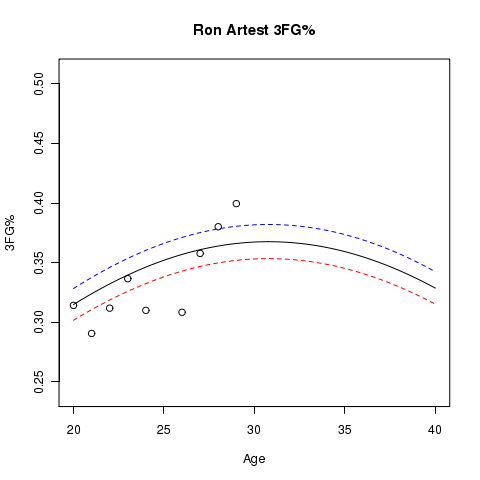
_________________
I am a basketball geek.
Back to top
View user's profile Send private message Visit poster's website
Kevin Pelton
Site Admin
Joined: 30 Dec 2004
Posts: 979
Location: Seattle
PostPosted: Tue Dec 22, 2009 2:34 pm Post subject: Reply with quote
Ryan J. Parker wrote:
Kevin, have you used more than just the change between last year and this year to come to that conclusion about Artest?
It's a rough reading of his career numbers, though heavily weighted toward the last two seasons, naturally.
Back to top
View user's profile Send private message Send e-mail Visit poster's website
Chronz1
Joined: 22 May 2006
Posts: 201
PostPosted: Tue Dec 22, 2009 2:38 pm Post subject: Reply with quote
Yea the Rockets and Lakers switch make for a great field test in the eff vs usg department. So do the entire Grizzlies team
The results are pretty much what I expected (Arizas loss in EFF with increased load), I never expected Artest efficiency to rise because I never saw that trait in him, hes moved around quite alot through his career and has never posted an uptick in Offensive RTG despite marginalizing his responsibilities.
Without knowing the results, I dont think Berri's decades worth evaluation is all that telling. Players do improve and measuring a players role from 1 year to the next in his development stage only answers if that player has improved, not if the theory holds up. Maybe if he were to measure players who are done developing (say 26+ years of age) or guys that have seemingly plateaued who experienced dramatic shifts in usage the next year. That would probably be more telling I think.
And I agree with your methodology on projecting a players success rate with more possessions, specifically the bit about assisting%. Dean has said his rule of thumb was basically point for point right. While I like the simplicity and makes for a good barometer, I know its not going to hold up for the majority of players in the league. Some players are far more dependent on others to create their quality looks regardless of the method there will still be a fair amount of subjectivity, and there should be.
Like I wouldnt expect a standstill shooter like Steve Kerr to continue his torrid shooting without MJ, and even if Ariza had a similar amount of shots created for him as an afterthought alongside Kobe, atleast you could expect him (given his athleticism) to do a better job of creating for himself.
How do we account for these abilities? I really dont know but I like where your taking this so Ill come along for the ride.
Back to top
View user's profile Send private message
Chronz1
Joined: 22 May 2006
Posts: 201
PostPosted: Tue Dec 22, 2009 2:44 pm Post subject: Reply with quote
Kevin Pelton wrote:
Good question. I was thinking about this the other day when I was writing about Ron Artest in L.A. He and Ariza have basically traded offensive roles, which is interesting. While that's pummeled Ariza's efficiency, Artest hasn't benefited all that much. In a strange way, this is actually a testament to Artest's value, because it demonstrates that his usage curve is fairly flat, so he can take on a lot more possessions fairly easily.
Im of the opinion that every player possesses a unique skill curve, so how would we go about proving or disproving the theories importance the way Berri attempted? How did Dean O settle on his point for point stance?
Back to top
View user's profile Send private message
DLew
Joined: 13 Nov 2006
Posts: 224
PostPosted: Tue Dec 22, 2009 4:05 pm Post subject: Reply with quote
Worth noting is that Berri's study ignores turnovers and focuses on efg%. Given what I've found when I've looked at this, I would say any study that does this is going to miss the bulk of the usage/efficiency trade off.
Back to top
View user's profile Send private message
devin3807
Joined: 11 Oct 2007
Posts: 66
PostPosted: Wed Dec 23, 2009 3:10 am Post subject: Reply with quote
I can't add to this, but I think Italian Stallion made a very good post in the comments section there, (naturally followed by Berri showing why so many people think he's a tool):
Quote:
#
Italian Stallion // December 22, 2009 at 5:03 pm
“If a statistical study suggests otherwise, it must be missing something.”
I made that statement and stand by it.
In fact, I think it’s so obviously correct, I can’t believe anyone that has ever played basketball disagrees with it.
IMO, the only debate is how much changes in usage impact efficiency, when, at what extremes of change it becomes easy to measure, and how we should measure it.
IMO, the first key point to understanding this is that the more a player increases his usage the greater the demands on his skill set are typically going to be.
For example, let’s use a post player without much shooting range (not unusual).
If he limits himself to dunks and lay-ups he can get “X” shots per 36 and do very well.
If a team focuses on getting him more dunks and lay-ups, they can probably increase “X” somewhat without altering efficiency, but there is a limit to that increase because the defense will try to prevent those very efficient shots. (We also know from observation that no team can get all dunks and lay-ups. Not even Wilt could when he dominated) .
If the player/team wants to increase “X” further than that, the player is going to have to take some shots further away from the basket, against double teams, or add some other slightly more difficult shots.
Those shots will typically be lower percentage shots as we know from various studies on shot success from various locations.
Then he will run up against the natural limit of that group and have to move further out etc…
The point at which that player/team should stop trying to increase “X” is where his efficiency falls below average ON THE NEW GROUP (key point) and/or when there are superior alternatives available on the team .
We also know that the more offensive skills a player has, the wider variety of shots he can make at adequate rates. (for example Larry Bird vs. Renaldo Balkman lol)
So we can conclude that great offensive players can increase “X” with little or no negative impact to Adjusted FG% MUCH better than poor offensive players (but even great ones eventually run up against their limit)
Coaches attempt to keep players within their limits and the players are constantly trying to increase their limits so their usage can rise and they can remain as efficient (then they make more money).
That’s the way basketball actually works!
The second part is measuring the impact.
As I suggested above, because we are talking about individual players with different offensive skill sets, there is probably no formula that is going to apply equally to all players!
Second, at any given time we don’t know how far any given player is away from his maximum potential/usage because he could easily be under or over utilized in any snapshot in time.
(An example of this might be the Celtics. They have so many great players there are probably several on that team that could easily increase their usage with little or no negative impact).
Third, because players are always trying to increase their skill set, variations in usage that seem to have no impact on efficiency could actually be measuring changes in skill and not suggesting that usage doesn’t matter.
So trying to create a formula for this OBVIOUS BASKETBALL REALITY is probably beyond anyone, let alone a basketball observer like me. Wink
However, I think an observation of the range of a player’s skills can help determine whether he can increase usage.
Looking at the detailed stats of how effective he is from various spots on the floor can help etc…
Finally, I’d like to point out how hard it is notice the impact even when it’s clearly there.
1. Assume a player has an adjusted FG% of 50% on his current mix of shots and takes 10 shots per 36 minutes.
Now let’s say he increases his shot attempts by 5 (or a whopping 50%).
If he shoots 45% on those incremental shots it changes his OVERALL Adj FG% to 48.3%.
If he shoots 40% on those incremental shots it changes his OVERALL Adj FG% to 46.7%.
That’s hardly even noticeable DESPITE a huge 50% increase in usage. So it could easily be written off to randomness, be impacted by randomness in the opposite way, or be seen as not particularly significant.
HOWEVER, the important point is that actual decrease in efficiency on the INCREMENTAL SHOTS was quite huge (a 10% drop and 5% drop) compared to the original group.
I said right after the Ariza trade that I expected his efficiency to drop if they upped his usage significantly because he’s not a particularly good outside shooter yet (even though he CLEARLY has been improving with time) and because he was recently benefiting from a couple of wide open looks per game as a result of playing with Kobe. I saw no way to increase his usage significantly and remain as efficient UNLESS he became a better outside shooter (which was possible because he is young and has been improving his outside shot)
IF I WERE TO ANALYZE ANOTHER PLAYER, I might conclude that he COULD EASILY INCREASE USAGE and REMAIN AS EFFICIENT.
THERE IS NO EASY FORMULA when player skill sets are different, usage levels are different, skill levels are changing, and players might be under or over utilized at any given time.
(REMEMBER, comparing old Adj FG% to new Adj FG% masks the impact. You have to look at the Adj FG% on the incremental shots, but that’s a very difficult thing to isolate without very detailed stats).
Back to top
View user's profile Send private message AIM Address
Chronz1
Joined: 22 May 2006
Posts: 201
PostPosted: Wed Dec 23, 2009 3:36 am Post subject: Reply with quote
Kevin Pelton wrote:
Good question. I was thinking about this the other day when I was writing about Ron Artest in L.A. He and Ariza have basically traded offensive roles, which is interesting. While that's pummeled Ariza's efficiency, Artest hasn't benefited all that much. In a strange way, this is actually a testament to Artest's value, because it demonstrates that his usage curve is fairly flat, so he can take on a lot more possessions fairly easily.
I dont see that as a compliment, not when your a bonafide chucker. Basically he cant be a valuable role player who helps his offense as much as possible in limited attempts (Ariza/Battier), nor can he sufficiently carry a team to elite levels offensively as a first or even secondary option. Isnt this the definition of a cancer? Im pretty sure hes hurt the Lakers offense this year, opposed to how well Ariza did in that role.
Back to top
View user's profile Send private message
BobboFitos
Joined: 21 Feb 2009
Posts: 201
Location: Cambridge, MA
PostPosted: Wed Dec 23, 2009 5:32 am Post subject: Reply with quote
Even though Ron Ron may hurt the Lakers' offense, and yes it's still super early, but he's 2nd on the team in APM. I'm of the opinion he's doing a fantastic job, and they are better this year than last year as a result...
_________________
http://pointsperpossession.com/
@PPPBasketball
Back to top
View user's profile Send private message
Chronz1
Joined: 22 May 2006
Posts: 201
PostPosted: Wed Dec 23, 2009 6:32 am Post subject: Reply with quote
BobboFitos wrote:
Even though Ron Ron may hurt the Lakers' offense, and yes it's still super early, but he's 2nd on the team in APM. I'm of the opinion he's doing a fantastic job, and they are better this year than last year as a result...
Without looking I think most of that stems from his defensive contributions, maybe cancer came off as too strong a word. His defense will always make him valuable, hows benign tumor sound?
Back to top
View user's profile Send private message
TheUntouchable
Joined: 30 Jul 2009
Posts: 12
PostPosted: Wed Dec 23, 2009 1:31 pm Post subject: Reply with quote
Chronz1 wrote:
BobboFitos wrote:
Even though Ron Ron may hurt the Lakers' offense, and yes it's still super early, but he's 2nd on the team in APM. I'm of the opinion he's doing a fantastic job, and they are better this year than last year as a result...
Without looking I think most of that stems from his defensive contributions, maybe cancer came off as too strong a word. His defense will always make him valuable, hows benign tumor sound?
I don't see why it matters. If he's helping them prevent points more than he's hurting them score points, then he's a positive player.
Back to top
View user's profile Send private message
Chronz1
Joined: 22 May 2006
Posts: 201
PostPosted: Wed Dec 23, 2009 2:36 pm Post subject: Reply with quote
TheUntouchable wrote:
Chronz1 wrote:
BobboFitos wrote:
Even though Ron Ron may hurt the Lakers' offense, and yes it's still super early, but he's 2nd on the team in APM. I'm of the opinion he's doing a fantastic job, and they are better this year than last year as a result...
Without looking I think most of that stems from his defensive contributions, maybe cancer came off as too strong a word. His defense will always make him valuable, hows benign tumor sound?
I don't see why it matters. If he's helping them prevent points more than he's hurting them score points, then he's a positive player.
No doubt, I was basically agreeing with you, just trying to say there is no denying his offensive limitations atleast from an individual efficiency standpoint, like I said I havent seen his on/off data. Isolating his offensive contributions means everything within the scope of the OP's topic.
Back to top
View user's profile Send private message
Simon
Joined: 03 Dec 2008
Posts: 13
PostPosted: Wed Dec 23, 2009 11:35 pm Post subject: Reply with quote
Even a benign tumor is something you'd rather not have and at best it's has a neutral effect. Artest has been remarkably good for the Lakers. If he just goes back to hitting free throws at his normal career rate, and there's no reason why he shouldn't, he'd be about as efficient as Ariza was and be helping the offense more than Ariza ever did. He's led the Lakers in assists most of the season, is one of their best post entry passers and to this point has been their best three point shooter.
I'd like to think his three point percentage would pick up to match the last two seasons as well, but honestly it seems like he shoots them better when there's a guy in his face and he's held it for two seconds as opposed to just spotting up.
Back to top
View user's profile Send private message
Joined: 26 Apr 2006
Posts: 665
PostPosted: Tue Dec 22, 2009 1:53 pm Post subject: Wages of Wins: Rockets, Ariza, Comment on Usg vs Eff Reply with quote
http://dberri.wordpress.com/2009/12/22/ ... -surprise/
As noted by Kevin Pelton, the Rockets this year serve as an interesting experiment in Usage vs Efficiency. Before the season, amongst the rotation regulars only Battier ever averaged more than 13 ppg for a season (he did so in his rookie year). Some felt that the lack of adept one-on-one scorers would hinder the Rockets offensive attack. So far, against arguably the most difficult schedule in the league, the Rockets are in the top half in offensive efficiency.
Do these results serve to validate the preseason analysis of the Rockets from Wages of Wins? Does it help support the theory that scoring is overrated? Is the "Usg vs Eff" relationship perhaps overstated, even by the general APBRMetrics community? He does acknowledge the case of Trevor Ariza, which would seem to bolster the argument that great usage will tend to drive down efficiency. But, in the grand scheme, he writes:
Quote:
The performance of the Rockets this season demonstrates an aspect of basketball performance often noted in this forum. Basketball players – relative to what we see in baseball and football – are very consistent over time. For the most part, the productivity of the players the Rockets are employing this season is not much different from what we saw last year. Yes, the loss of the team’s primary scorers has forced other players to take shots. In general, though, the increase in shot attempts hasn’t reduced each player’s effectiveness.
Also, from his research of decades worth of data:
Quote:
When you look at players from 1977-78 to 2007-08 (the sample includes over 5,000 season observations) you see that there is a link between a change in the number of shots he takes and his shooting efficiency. But the impact is quite small. Here is what we say in our next book: “…imagine a player who takes 16.3 shots per 48 minutes and has an adjusted field goal percentage of 48.4% (these are the league average marks). If that player increased his shots per 48 minutes to 25.3 (a two standard deviation increase), his adjusted field goal percentage would be expected to decline to 47.1%.
My question is: how can we predict whether increase in usage will result in a big decrease in efficiency, a marginal decrease in efficiency, or perhaps improved efficiency? We have models, apparently, that suggest in general there is a drop, but can we get more precise (in an automatic way, not via scouting) by considering details specific to the player? For example, is there a smart way to determine from the data that Landry would not become much less efficient with more touches, while Ariza would?
Some thoughts on this:
* If the player has a history of playing efficiently with increased usage (e.g., maybe there was an injury that forced him into that role for a few weeks), that should be taken into account.
* Considering the % of FGM that were unassisted will separate players who are adept at creating their own shot. Perhaps such players are less likely to see a dip in their efficiency.
* How does a player's efficiency change based on the "combined usage" of the other 4 players he's sharing the floor with? A different take on Dean Oliver's "skill curves", but I think that could be interesting to look at.
Back to top
View user's profile Send private message
Kevin Pelton
Site Admin
Joined: 30 Dec 2004
Posts: 979
Location: Seattle
PostPosted: Tue Dec 22, 2009 2:05 pm Post subject: Reply with quote
Good question. I was thinking about this the other day when I was writing about Ron Artest in L.A. He and Ariza have basically traded offensive roles, which is interesting. While that's pummeled Ariza's efficiency, Artest hasn't benefited all that much. In a strange way, this is actually a testament to Artest's value, because it demonstrates that his usage curve is fairly flat, so he can take on a lot more possessions fairly easily.
Back to top
View user's profile Send private message Send e-mail Visit poster's website
Ryan J. Parker
Joined: 23 Mar 2007
Posts: 711
Location: Raleigh, NC
PostPosted: Tue Dec 22, 2009 2:06 pm Post subject: Reply with quote
Do you happen to have a link to the methodology he used in his research? I've found that usage is a better indicator than % of shots taken when measuring the relationship between usage and efficiency. Also, I'd prefer an analysis in terms of possessions instead of minutes.
As for your question, there are models that allow us to estimate how players differ from other players. Take my post on age, usage, and 3FG% as an example. The model behind this allows for player specific aging curves and usage lines. For example, when you compare Ray Allen's graph to Robert Horry's graph, you see that the impact of Allen's increase in usage is different to Horry's.
So the answer to your question is yes, it can be done. I think it would be interesting to study more than just 3FG%, and also it would be good to consider how player type/skill set impacts this relationship as well.
_________________
I am a basketball geek.
Back to top
View user's profile Send private message Visit poster's website
Ryan J. Parker
Joined: 23 Mar 2007
Posts: 711
Location: Raleigh, NC
PostPosted: Tue Dec 22, 2009 2:12 pm Post subject: Reply with quote
Kevin, have you used more than just the change between last year and this year to come to that conclusion about Artest? I haven't taken an in depth look at his career, but here is Artest's graphic the model produces (blue=10% usage, black=20% usage, red=30% usage):
_________________
I am a basketball geek.
Back to top
View user's profile Send private message Visit poster's website
Kevin Pelton
Site Admin
Joined: 30 Dec 2004
Posts: 979
Location: Seattle
PostPosted: Tue Dec 22, 2009 2:34 pm Post subject: Reply with quote
Ryan J. Parker wrote:
Kevin, have you used more than just the change between last year and this year to come to that conclusion about Artest?
It's a rough reading of his career numbers, though heavily weighted toward the last two seasons, naturally.
Back to top
View user's profile Send private message Send e-mail Visit poster's website
Chronz1
Joined: 22 May 2006
Posts: 201
PostPosted: Tue Dec 22, 2009 2:38 pm Post subject: Reply with quote
Yea the Rockets and Lakers switch make for a great field test in the eff vs usg department. So do the entire Grizzlies team
The results are pretty much what I expected (Arizas loss in EFF with increased load), I never expected Artest efficiency to rise because I never saw that trait in him, hes moved around quite alot through his career and has never posted an uptick in Offensive RTG despite marginalizing his responsibilities.
Without knowing the results, I dont think Berri's decades worth evaluation is all that telling. Players do improve and measuring a players role from 1 year to the next in his development stage only answers if that player has improved, not if the theory holds up. Maybe if he were to measure players who are done developing (say 26+ years of age) or guys that have seemingly plateaued who experienced dramatic shifts in usage the next year. That would probably be more telling I think.
And I agree with your methodology on projecting a players success rate with more possessions, specifically the bit about assisting%. Dean has said his rule of thumb was basically point for point right. While I like the simplicity and makes for a good barometer, I know its not going to hold up for the majority of players in the league. Some players are far more dependent on others to create their quality looks regardless of the method there will still be a fair amount of subjectivity, and there should be.
Like I wouldnt expect a standstill shooter like Steve Kerr to continue his torrid shooting without MJ, and even if Ariza had a similar amount of shots created for him as an afterthought alongside Kobe, atleast you could expect him (given his athleticism) to do a better job of creating for himself.
How do we account for these abilities? I really dont know but I like where your taking this so Ill come along for the ride.
Back to top
View user's profile Send private message
Chronz1
Joined: 22 May 2006
Posts: 201
PostPosted: Tue Dec 22, 2009 2:44 pm Post subject: Reply with quote
Kevin Pelton wrote:
Good question. I was thinking about this the other day when I was writing about Ron Artest in L.A. He and Ariza have basically traded offensive roles, which is interesting. While that's pummeled Ariza's efficiency, Artest hasn't benefited all that much. In a strange way, this is actually a testament to Artest's value, because it demonstrates that his usage curve is fairly flat, so he can take on a lot more possessions fairly easily.
Im of the opinion that every player possesses a unique skill curve, so how would we go about proving or disproving the theories importance the way Berri attempted? How did Dean O settle on his point for point stance?
Back to top
View user's profile Send private message
DLew
Joined: 13 Nov 2006
Posts: 224
PostPosted: Tue Dec 22, 2009 4:05 pm Post subject: Reply with quote
Worth noting is that Berri's study ignores turnovers and focuses on efg%. Given what I've found when I've looked at this, I would say any study that does this is going to miss the bulk of the usage/efficiency trade off.
Back to top
View user's profile Send private message
devin3807
Joined: 11 Oct 2007
Posts: 66
PostPosted: Wed Dec 23, 2009 3:10 am Post subject: Reply with quote
I can't add to this, but I think Italian Stallion made a very good post in the comments section there, (naturally followed by Berri showing why so many people think he's a tool):
Quote:
#
Italian Stallion // December 22, 2009 at 5:03 pm
“If a statistical study suggests otherwise, it must be missing something.”
I made that statement and stand by it.
In fact, I think it’s so obviously correct, I can’t believe anyone that has ever played basketball disagrees with it.
IMO, the only debate is how much changes in usage impact efficiency, when, at what extremes of change it becomes easy to measure, and how we should measure it.
IMO, the first key point to understanding this is that the more a player increases his usage the greater the demands on his skill set are typically going to be.
For example, let’s use a post player without much shooting range (not unusual).
If he limits himself to dunks and lay-ups he can get “X” shots per 36 and do very well.
If a team focuses on getting him more dunks and lay-ups, they can probably increase “X” somewhat without altering efficiency, but there is a limit to that increase because the defense will try to prevent those very efficient shots. (We also know from observation that no team can get all dunks and lay-ups. Not even Wilt could when he dominated) .
If the player/team wants to increase “X” further than that, the player is going to have to take some shots further away from the basket, against double teams, or add some other slightly more difficult shots.
Those shots will typically be lower percentage shots as we know from various studies on shot success from various locations.
Then he will run up against the natural limit of that group and have to move further out etc…
The point at which that player/team should stop trying to increase “X” is where his efficiency falls below average ON THE NEW GROUP (key point) and/or when there are superior alternatives available on the team .
We also know that the more offensive skills a player has, the wider variety of shots he can make at adequate rates. (for example Larry Bird vs. Renaldo Balkman lol)
So we can conclude that great offensive players can increase “X” with little or no negative impact to Adjusted FG% MUCH better than poor offensive players (but even great ones eventually run up against their limit)
Coaches attempt to keep players within their limits and the players are constantly trying to increase their limits so their usage can rise and they can remain as efficient (then they make more money).
That’s the way basketball actually works!
The second part is measuring the impact.
As I suggested above, because we are talking about individual players with different offensive skill sets, there is probably no formula that is going to apply equally to all players!
Second, at any given time we don’t know how far any given player is away from his maximum potential/usage because he could easily be under or over utilized in any snapshot in time.
(An example of this might be the Celtics. They have so many great players there are probably several on that team that could easily increase their usage with little or no negative impact).
Third, because players are always trying to increase their skill set, variations in usage that seem to have no impact on efficiency could actually be measuring changes in skill and not suggesting that usage doesn’t matter.
So trying to create a formula for this OBVIOUS BASKETBALL REALITY is probably beyond anyone, let alone a basketball observer like me. Wink
However, I think an observation of the range of a player’s skills can help determine whether he can increase usage.
Looking at the detailed stats of how effective he is from various spots on the floor can help etc…
Finally, I’d like to point out how hard it is notice the impact even when it’s clearly there.
1. Assume a player has an adjusted FG% of 50% on his current mix of shots and takes 10 shots per 36 minutes.
Now let’s say he increases his shot attempts by 5 (or a whopping 50%).
If he shoots 45% on those incremental shots it changes his OVERALL Adj FG% to 48.3%.
If he shoots 40% on those incremental shots it changes his OVERALL Adj FG% to 46.7%.
That’s hardly even noticeable DESPITE a huge 50% increase in usage. So it could easily be written off to randomness, be impacted by randomness in the opposite way, or be seen as not particularly significant.
HOWEVER, the important point is that actual decrease in efficiency on the INCREMENTAL SHOTS was quite huge (a 10% drop and 5% drop) compared to the original group.
I said right after the Ariza trade that I expected his efficiency to drop if they upped his usage significantly because he’s not a particularly good outside shooter yet (even though he CLEARLY has been improving with time) and because he was recently benefiting from a couple of wide open looks per game as a result of playing with Kobe. I saw no way to increase his usage significantly and remain as efficient UNLESS he became a better outside shooter (which was possible because he is young and has been improving his outside shot)
IF I WERE TO ANALYZE ANOTHER PLAYER, I might conclude that he COULD EASILY INCREASE USAGE and REMAIN AS EFFICIENT.
THERE IS NO EASY FORMULA when player skill sets are different, usage levels are different, skill levels are changing, and players might be under or over utilized at any given time.
(REMEMBER, comparing old Adj FG% to new Adj FG% masks the impact. You have to look at the Adj FG% on the incremental shots, but that’s a very difficult thing to isolate without very detailed stats).
Back to top
View user's profile Send private message AIM Address
Chronz1
Joined: 22 May 2006
Posts: 201
PostPosted: Wed Dec 23, 2009 3:36 am Post subject: Reply with quote
Kevin Pelton wrote:
Good question. I was thinking about this the other day when I was writing about Ron Artest in L.A. He and Ariza have basically traded offensive roles, which is interesting. While that's pummeled Ariza's efficiency, Artest hasn't benefited all that much. In a strange way, this is actually a testament to Artest's value, because it demonstrates that his usage curve is fairly flat, so he can take on a lot more possessions fairly easily.
I dont see that as a compliment, not when your a bonafide chucker. Basically he cant be a valuable role player who helps his offense as much as possible in limited attempts (Ariza/Battier), nor can he sufficiently carry a team to elite levels offensively as a first or even secondary option. Isnt this the definition of a cancer? Im pretty sure hes hurt the Lakers offense this year, opposed to how well Ariza did in that role.
Back to top
View user's profile Send private message
BobboFitos
Joined: 21 Feb 2009
Posts: 201
Location: Cambridge, MA
PostPosted: Wed Dec 23, 2009 5:32 am Post subject: Reply with quote
Even though Ron Ron may hurt the Lakers' offense, and yes it's still super early, but he's 2nd on the team in APM. I'm of the opinion he's doing a fantastic job, and they are better this year than last year as a result...
_________________
http://pointsperpossession.com/
@PPPBasketball
Back to top
View user's profile Send private message
Chronz1
Joined: 22 May 2006
Posts: 201
PostPosted: Wed Dec 23, 2009 6:32 am Post subject: Reply with quote
BobboFitos wrote:
Even though Ron Ron may hurt the Lakers' offense, and yes it's still super early, but he's 2nd on the team in APM. I'm of the opinion he's doing a fantastic job, and they are better this year than last year as a result...
Without looking I think most of that stems from his defensive contributions, maybe cancer came off as too strong a word. His defense will always make him valuable, hows benign tumor sound?
Back to top
View user's profile Send private message
TheUntouchable
Joined: 30 Jul 2009
Posts: 12
PostPosted: Wed Dec 23, 2009 1:31 pm Post subject: Reply with quote
Chronz1 wrote:
BobboFitos wrote:
Even though Ron Ron may hurt the Lakers' offense, and yes it's still super early, but he's 2nd on the team in APM. I'm of the opinion he's doing a fantastic job, and they are better this year than last year as a result...
Without looking I think most of that stems from his defensive contributions, maybe cancer came off as too strong a word. His defense will always make him valuable, hows benign tumor sound?
I don't see why it matters. If he's helping them prevent points more than he's hurting them score points, then he's a positive player.
Back to top
View user's profile Send private message
Chronz1
Joined: 22 May 2006
Posts: 201
PostPosted: Wed Dec 23, 2009 2:36 pm Post subject: Reply with quote
TheUntouchable wrote:
Chronz1 wrote:
BobboFitos wrote:
Even though Ron Ron may hurt the Lakers' offense, and yes it's still super early, but he's 2nd on the team in APM. I'm of the opinion he's doing a fantastic job, and they are better this year than last year as a result...
Without looking I think most of that stems from his defensive contributions, maybe cancer came off as too strong a word. His defense will always make him valuable, hows benign tumor sound?
I don't see why it matters. If he's helping them prevent points more than he's hurting them score points, then he's a positive player.
No doubt, I was basically agreeing with you, just trying to say there is no denying his offensive limitations atleast from an individual efficiency standpoint, like I said I havent seen his on/off data. Isolating his offensive contributions means everything within the scope of the OP's topic.
Back to top
View user's profile Send private message
Simon
Joined: 03 Dec 2008
Posts: 13
PostPosted: Wed Dec 23, 2009 11:35 pm Post subject: Reply with quote
Even a benign tumor is something you'd rather not have and at best it's has a neutral effect. Artest has been remarkably good for the Lakers. If he just goes back to hitting free throws at his normal career rate, and there's no reason why he shouldn't, he'd be about as efficient as Ariza was and be helping the offense more than Ariza ever did. He's led the Lakers in assists most of the season, is one of their best post entry passers and to this point has been their best three point shooter.
I'd like to think his three point percentage would pick up to match the last two seasons as well, but honestly it seems like he shoots them better when there's a guy in his face and he's held it for two seconds as opposed to just spotting up.
Back to top
View user's profile Send private message
Re: Recovered old threads- miscellaneous topics
Mike G
Joined: 14 Jan 2005
Posts: 3630
Location: Hendersonville, NC
PostPosted: Mon Jun 09, 2008 2:45 pm Post subject: Celtics vs Lakers Reply with quote
Boston 2, LA 0
Code:
eW per36 rates tm Min Eff% Sco Reb Ast Stl TO Blk T
.38 Pierce,Paul Bos 36 .758 35.6 5.2 5.7 1.1 4.3 .5 44.7
.34 Garnett,Kevin Bos 40 .446 19.7 15.9 3.1 1.0 2.4 .5 38.6
.28 Bryant,Kobe LA 41 .486 24.0 3.6 5.4 1.8 3.7 .5 33.4
.24 Rondo,Rajon Bos 39 .432 9.5 6.7 12.3 1.0 2.0 .5 32.0
.22 Gasol,Pau LA 41 .627 15.7 9.3 3.1 .9 .9 .5 29.6
.19 Allen,Ray Bos 43 .610 19.0 5.5 3.4 .5 2.8 .5 26.5
.14 Radmanovic,Vladi LA 24 .529 13.2 12.9 2.6 2.3 .8 .0 31.3
.12 Fisher,Derek LA 36 .545 12.7 2.4 4.0 3.2 1.1 .0 23.9
.10 Powe,Leon Bos 12 .806 31.4 7.0 .0 .0 .0 .0 37.4
.08 Odom,Lamar LA 36 .490 11.6 8.3 1.3 .5 1.1 .0 20.2
.01 Perkins,Kendrick Bos 19 .727 10.0 8.4 1.0 .0 3.0 1.0 15.7
.00 Cassell,Sam Bos 10 .364 8.1 0.0 2.4 2.3 .0 .0 15.1
.00 Brown,PJ Bos 22 .500 4.7 6.6 1.3 .6 .0 .6 14.3
.00 Farmar,Jordan LA 13 .786 12.2 2.3 .0 .0 1.0 1.0 14.1
-.01 Turiaf,Ronny LA 11 .563 9.5 2.7 .0 .0 .0 .0 11.0
-.01 Posey,James Bos 22 .550 6.9 3.7 .0 1.9 1.2 .0 11.8
-.03 Vujacic,Sasha LA 24 .552 9.9 1.4 1.1 .0 1.3 .0 10.3
-.05 Walton,Luke LA 14 .250 1.3 3.3 .8 .0 2.0 .0 2.4
Pierce has the Jordan-like numbers so far, but he's always been a playoff overachiever. Kobe looks more like Arenas or DWade this year.
I posted a Jordan/Kobe career comparison over here:
http://www.apbr.org/forum/viewtopic.php?t=1650
_________________
`
36% of all statistics are wrong
Back to top
View user's profile Send private message Send e-mail
Mike G
Joined: 14 Jan 2005
Posts: 3630
Location: Hendersonville, NC
PostPosted: Wed Jun 11, 2008 9:25 am Post subject: Reply with quote
Celts 2, Lakers 1
Code:
eW per36 rates tm Min Eff% Sco Reb Ast Stl TO Blk T
.50 Bryant,Kobe LA 42 .533 28.4 4.5 3.9 1.8 3.2 .3 37.1
.43 Garnett,Kevin Bos 41 .397 16.8 13.4 3.5 .9 2.5 1.3 34.6
.34 Allen,Ray Bos 42 .670 21.9 5.0 2.8 .6 2.1 .6 29.4
.33 Pierce,Paul Bos 35 .577 23.7 5.6 4.9 1.1 4.0 .4 32.4
.27 Rondo,Rajon Bos 33 .450 11.0 5.5 10.6 .8 2.3 .8 29.5
.27 Gasol,Pau LA 40 .532 13.4 10.2 2.8 .6 1.5 .3 26.4
.15 Fisher,Derek LA 33 .500 11.7 2.9 3.4 2.6 1.1 .0 21.8
.15 Radmanovic,Vladi LA 20 .500 12.7 10.6 2.2 1.8 .6 .0 27.4
.13 Odom,Lamar LA 33 .418 10.3 9.5 2.4 .8 2.6 .4 20.5
.11 Perkins,Kendrick Bos 22 .727 11.3 8.2 1.2 1.7 2.3 1.7 22.3
.10 Vujacic,Sasha LA 25 .679 17.3 2.8 1.2 .0 .9 .4 20.5
.10 Powe,Leon Bos 10 .667 27.0 7.6 .0 .0 .9 .0 32.7
.07 Farmar,Jordan LA 15 .727 12.3 4.4 3.0 .0 .7 1.3 21.3
.05 Posey,James Bos 23 .625 9.4 5.7 .0 1.7 .9 .0 16.6
.02 Cassell,Sam Bos 9 .333 9.1 0.0 4.0 2.0 .0 .0 17.6
.02 House,Eddie Bos 7 .375 8.1 4.7 3.0 1.4 .0 .0 18.8
.00 Brown,PJ Bos 20 .423 5.1 5.7 1.0 .5 .9 .9 12.3
.00 Ariza,Trevor LA 5 .500 7.0 5.6 1.5 .0 1.7 .0 12.0
-.02 Turiaf,Ronny LA 13 .500 6.0 1.6 .0 .0 .0 1.5 8.5
-.03 Walton,Luke LA 13 .143 1.0 5.0 2.1 .0 1.5 .8 7.2
Suddenly:
Kobe's the only superstar.
Garnett can't shoot at all.
Ray is 6 months younger.
Pierce is just Pierce.
Rondo is Johnny Moore.
Radman is Rodman.
_________________
`
36% of all statistics are wrong
Back to top
View user's profile Send private message Send e-mail
Mike G
Joined: 14 Jan 2005
Posts: 3630
Location: Hendersonville, NC
PostPosted: Fri Jun 13, 2008 9:37 am Post subject: Reply with quote
Celtics 3, Lakers 1
It's dreadfully premature, but who can be mvp of these Finals?
- Kobe's team doesn't look like it's going to win.
- Garnett's shooting is worse than any Finals mvp could be.
- Ray hardly sits, hardly misses; but doesn't really dominate anywhere.
- Pierce has been hot and cold, racks up TO and fouls.
The big final game will decide.
Code:
eW per36 rates tm Min Eff% Sco Reb Ast Stl TO Blk T
.63 Bryant,Kobe LA 43 .502 24.4 4.1 4.9 2.2 2.8 .2 33.6
.59 Garnett,Kevin Bos 40 .422 16.6 13.5 3.5 1.2 2.9 1.2 33.4
.53 Allen,Ray Bos 44 .678 21.2 5.9 2.5 1.1 1.7 .7 29.9
.48 Pierce,Paul Bos 37 .576 23.4 5.3 5.4 1.0 3.9 .5 31.2
.35 Gasol,Pau LA 40 .527 14.2 9.9 2.5 .5 1.9 .2 24.9
.31 Rondo,Rajon Bos 29 .457 11.0 5.2 9.8 .7 2.0 .7 27.5
.26 Odom,Lamar LA 35 .505 13.0 9.4 2.7 .5 2.4 .5 22.8
.19 Radmanovic,Vladi LA 22 .517 12.6 9.4 2.3 1.3 .4 .0 24.7
.18 Fisher,Derek LA 31 .566 14.1 2.2 3.5 2.1 1.8 .0 20.7
.12 Powe,Leon Bos 10 .592 23.6 10.2 .0 .0 1.4 .0 30.5
.10 Posey,James Bos 23 .679 13.5 5.1 .0 1.3 .6 .0 18.7
.10 Perkins,Kendrick Bos 20 .643 10.3 7.6 1.0 1.4 1.9 1.9 19.5
.07 Vujacic,Sasha LA 25 .549 12.9 3.1 1.2 .3 1.0 .3 16.2
.06 Farmar,Jordan LA 17 .559 9.1 4.5 2.5 .0 .5 .9 17.4
.06 House,Eddie Bos 11 .472 10.9 5.3 2.1 .7 .0 .0 19.5
.06 Ariza,Trevor LA 6 .714 13.6 9.7 1.0 1.1 1.1 1.1 25.2
.00 Cassell,Sam Bos 8 .313 6.8 .0 3.3 1.6 .8 .0 11.7
-.01 Brown,PJ Bos 19 .389 4.8 5.7 .8 .8 .8 .8 11.7
-.04 Turiaf,Ronny LA 13 .409 4.2 1.9 .0 .0 .0 1.8 7.3
-.04 Walton,Luke LA 11 .250 2.5 4.4 1.9 .0 2.1 .7 6.3
The non-contributors at the bottom all had their moments in earlier rounds. The Celts' rotation is drifting back to the successful one we saw earlier: less Sam and PJ, more of House.
_________________
`
36% of all statistics are wrong
Back to top
View user's profile Send private message Send e-mail
Ryan J. Parker
Joined: 23 Mar 2007
Posts: 711
Location: Raleigh, NC
PostPosted: Fri Jun 13, 2008 9:48 am Post subject: Reply with quote
Quote:
It's dreadfully premature, but who can be mvp of these Finals?
If the Celtics win, then my vote goes to the theory of: "...had Pierce not come back in game 1...". So Pierce, of course.
Back to top
View user's profile Send private message Visit poster's website
94by50
Joined: 01 Jan 2006
Posts: 499
Location: Phoenix
PostPosted: Fri Jun 13, 2008 3:36 pm Post subject: Reply with quote
I suspect Pierce will win by default (if no one stands out, pick the top scorer).
Back to top
View user's profile Send private message
Mike G
Joined: 14 Jan 2005
Posts: 3630
Location: Hendersonville, NC
PostPosted: Sat Jun 14, 2008 1:03 pm Post subject: Reply with quote
Round-by-round, the primary Celtics. 'e480' is equivalent-wins generated per 480 minutes. A rate of 1.00 is average for a series. After 4 games of the Finals. Productions are per36, standardized :
Code:
Bos Allen,Ray
vs e480 Min Eff% Sco Reb Ast PF Stl TO Blk 3s T
Atl 1.06 38 .536 18.7 3.7 3.0 2.2 .7 .8 .3 18 26.7
Cle .55 37 .451 11.0 3.8 2.5 2.1 .9 1.6 .3 4 17.0
Det 1.14 36 .574 19.9 4.6 3.1 2.9 .8 1.7 .0 11 25.2
LA 1.47 44 .678 21.2 5.9 2.5 2.2 1.1 1.7 .7 12 29.9
Bos Garnett,Kevin
vs e480 Min Eff% Sco Reb Ast PF Stl TO Blk 3s T
Atl 2.26 37 .529 25.0 9.9 3.8 3.0 2.0 2.0 1.4 1 42.3
Cle 2.09 39 .571 22.8 12.1 3.5 2.5 .8 1.1 1.0 0 40.1
Det 2.37 38 .573 24.4 11.9 2.9 3.0 .8 2.7 .9 1 36.4
LA 1.77 40 .422 16.6 13.5 3.5 2.1 1.2 2.9 1.2 0 33.4
Bos Pierce,Paul
vs e480 Min Eff% Sco Reb Ast PF Stl TO Blk 3s T
Atl 1.77 33 .555 24.7 5.7 5.1 3.9 1.3 2.5 .2 15 36.0
Cle 1.47 38 .521 23.9 5.7 3.7 3.4 1.1 3.4 .1 11 30.9
Det 1.08 43 .590 18.4 6.3 3.2 2.4 .7 2.8 .6 6 24.6
LA 1.59 37 .576 23.4 5.3 5.4 4.4 1.0 3.9 .5 7 31.2
Bos Rondo,Rajon
vs e480 Min Eff% Sco Reb Ast PF Stl TO Blk 3s T
Atl 1.63 31 .482 15.3 5.6 8.6 3.4 2.0 1.2 .2 1 34.2
Cle 1.38 31 .484 15.8 5.7 7.6 3.5 1.7 3.1 .5 3 29.5
Det .66 39 .393 9.5 5.2 6.1 3.2 2.2 2.0 .2 1 20.7
LA 1.28 29 .457 11.0 5.2 9.8 2.9 .7 2.0 .7 0 27.5
Bos Perkins,Kendrick
vs e480 Min Eff% Sco Reb Ast PF Stl TO Blk 3s T
Atl 1.40 24 .671 16.7 11.0 .4 4.8 .9 1.1 2.6 0 31.1
Cle .54 25 .473 8.9 8.3 1.3 5.3 .6 3.2 1.7 0 16.9
Det 1.31 32 .667 12.1 13.6 .6 4.4 1.0 1.0 1.3 0 26.7
LA .61 20 .643 10.3 7.6 1.0 7.7 1.4 1.9 1.9 0 19.5
Bos Posey,James
vs e480 Min Eff% Sco Reb Ast PF Stl TO Blk 3s T
Atl 1.13 23 .591 14.2 7.1 2.1 3.2 1.9 .6 1.1 11 27.6
Cle .35 21 .621 7.3 4.9 1.5 2.7 .9 .5 .2 7 14.1
Det .85 19 .531 13.5 7.3 2.5 5.3 1.4 1.1 .4 5 22.5
LA .54 23 .679 13.5 5.1 .0 3.6 1.3 .6 .0 8 18.7
These 6 are actually the only Celtics to be in the steady rotation. Everyone else has been forgotten at one time or another in these playoffs.
Garnett has been the Celts' most important player in every round.
Here are the Lakers:
Code:
LA Bryant,Kobe
vs e480 Min Eff% Sco Reb Ast PF Stl TO Blk 3s T
Den 2.58 39 .583 34.4 4.8 5.1 3.3 1.4 2.6 1.4 10 46.6
Uta 2.20 41 .607 30.4 7.5 6.2 3.0 .8 3.7 .2 5 41.8
SA 2.33 40 .582 29.4 5.4 3.1 1.2 1.4 2.1 .0 8 36.1
Bos 1.79 43 .502 24.4 4.1 4.9 3.0 2.2 2.8 .2 2 33.6
LA Gasol,Pau
vs e480 Min Eff% Sco Reb Ast PF Stl TO Blk 3s T
Den 1.93 40 .622 23.5 8.1 4.0 1.6 .0 1.4 2.5 0 38.1
Uta 1.40 43 .572 15.8 8.6 3.5 3.0 .5 2.6 2.7 0 29.8
SA 1.62 37 .468 14.7 10.3 3.2 2.5 1.0 1.6 1.6 0 29.6
Bos 1.06 40 .527 14.2 9.9 2.5 3.3 .5 1.9 .2 0 24.9
LA Odom,Lamar
vs e480 Min Eff% Sco Reb Ast PF Stl TO Blk 3s T
Den 1.25 35 .443 12.1 10.0 4.5 3.7 1.6 1.6 .5 0 29.1
Uta 1.44 43 .630 15.3 12.1 1.7 3.0 .8 1.7 1.8 2 30.4
SA 1.36 34 .471 15.9 11.6 2.8 3.3 .2 3.1 1.5 0 27.2
Bos .89 35 .505 13.0 9.4 2.7 4.3 .5 2.4 .5 0 22.8
LA Fisher,Derek
vs e480 Min Eff% Sco Reb Ast PF Stl TO Blk 3s T
Den .53 32 .531 9.8 4.0 2.5 3.7 1.7 .6 .6 6 19.6
Uta .98 35 .746 14.9 2.3 2.9 3.1 3.9 1.3 .2 11 23.5
SA .11 27 .449 9.8 4.0 1.5 4.2 1.9 .6 .0 2 15.6
Bos .71 31 .566 14.1 2.2 3.5 3.0 2.1 1.8 .0 2 20.7
LA Radmanovic,Vladi
vs e480 Min Eff% Sco Reb Ast PF Stl TO Blk 3s T
Den .82 25 .423 11.7 7.0 4.0 3.4 .8 1.5 .4 7 23.5
Uta .52 21 .583 12.7 3.7 1.6 3.8 1.2 1.7 .0 9 16.6
SA .46 26 .677 14.0 7.0 1.6 3.5 .9 2.0 .0 3 18.9
Bos 1.05 22 .517 12.6 9.4 2.3 6.3 1.3 .4 .0 7 24.7
LA Vujacic,Sasha
vs e480 Min Eff% Sco Reb Ast PF Stl TO Blk 3s T
Den .86 19 .674 19.8 2.4 1.3 3.2 .9 1.4 .5 8 24.0
Uta .37 20 .615 10.7 3.5 .8 2.6 .4 .9 .2 9 14.3
SA .09 26 .453 11.4 4.9 1.1 3.2 1.5 1.8 .3 6 15.5
Bos .33 25 .549 12.9 3.1 1.2 4.0 .3 1.0 .3 7 16.2
LA Farmar,Jordan
vs e480 Min Eff% Sco Reb Ast PF Stl TO Blk 3s T
Den .37 17 .446 11.2 3.0 4.0 2.6 .5 2.0 .0 2 17.6
Uta -.26 13 .204 2.4 2.3 1.3 2.5 .6 1.1 .0 1 4.9
SA .83 20 .560 18.4 3.8 1.8 2.3 .8 1.5 .4 5 22.3
Bos .43 17 .559 9.1 4.5 2.5 .9 .0 .5 .9 5 17.4
LA Walton,Luke
vs e480 Min Eff% Sco Reb Ast PF Stl TO Blk 3s T
Den 2.30 25 .757 30.6 7.2 5.0 4.2 .7 2.1 .3 4 43.0
Uta .18 18 .476 6.6 3.2 2.2 4.2 1.2 1.6 .5 3 11.6
SA 1.11 16 .421 13.4 9.2 4.1 2.9 1.5 2.0 .0 2 24.9
Bos -.49 11 .250 2.5 4.4 1.9 4.2 .0 2.1 .7 1 6.3
Several guys with serious ups and downs.
Walton has been as good as Kobe and as bad as anyone.
_________________
`
36% of all statistics are wrong
Last edited by Mike G on Tue Jun 17, 2008 5:18 am; edited 1 time in total
Back to top
View user's profile Send private message Send e-mail
Mike G
Joined: 14 Jan 2005
Posts: 3630
Location: Hendersonville, NC
PostPosted: Mon Jun 16, 2008 8:25 am Post subject: Reply with quote
Bos 3, LA 2
Code:
eW per36 rates tm Min Eff% Sco Reb Ast Stl TO Blk T
.77 Bryant,Kobe LA 43 .504 23.6 4.6 4.5 2.6 3.2 .2 32.6
.73 Pierce,Paul Bos 39 .585 25.9 5.2 5.4 1.0 3.8 .4 33.6
.65 Garnett,Kevin Bos 38 .432 15.7 14.1 2.8 1.4 3.1 1.0 31.6
.55 Gasol,Pau LA 40 .550 15.0 10.4 3.0 .5 1.5 .5 28.0
.54 Allen,Ray Bos 43 .644 19.4 5.1 2.3 .9 1.7 .7 26.7
.42 Odom,Lamar LA 36 .578 15.2 9.7 2.4 .4 2.7 1.2 25.6
.31 Rondo,Rajon Bos 26 .407 9.8 5.2 9.4 .9 2.3 .9 25.9
.24 Radmanovic,Vladi LA 21 .528 13.4 9.9 2.6 1.4 1.4 .0 25.2
.23 Fisher,Derek LA 32 .542 14.5 2.3 3.2 2.1 1.9 .0 20.6
.17 Powe,Leon Bos 9 .592 24.8 12.7 .0 .0 1.5 .0 33.7
.11 Farmar,Jordan LA 18 .577 11.4 4.1 2.4 .4 .4 1.1 20.0
.11 Posey,James Bos 25 .683 11.7 5.8 .5 1.3 1.0 .0 17.7
.10 Perkins,Kendrick Bos 16 .643 10.3 7.8 1.0 1.5 2.0 2.0 19.6
.07 House,Eddie Bos 12 .500 12.3 4.9 2.7 .5 1.1 .0 19.4
.07 Ariza,Trevor LA 5 .714 14.6 10.6 1.1 1.2 1.2 1.2 27.1
.04 Vujacic,Sasha LA 24 .473 10.9 3.1 1.0 .6 .9 .3 14.3
.02 Cassell,Sam Bos 10 .388 10.4 0.7 3.7 1.2 1.2 .0 15.3
-.03 Brown,PJ Bos 20 .391 4.7 5.7 .6 .6 .6 .6 10.9
-.05 Walton,Luke LA 10 .292 3.3 4.0 2.8 .0 1.9 .6 7.5
-.05 Turiaf,Ronny LA 10 .409 4.6 2.1 .0 .0 .6 1.9 6.8
Farmar is the 5th-best shotblocker in these Finals.
In eWins, it's Bos 2.70, LA 2.30 .
_________________
`
36% of all statistics are wrong
Back to top
View user's profile Send private message Send e-mail
Mike G
Joined: 14 Jan 2005
Posts: 3630
Location: Hendersonville, NC
PostPosted: Wed Jun 18, 2008 8:22 am Post subject: Reply with quote
The stats don't support the mvp choice, unless you figure Pierce had much to do with Kobe's suppression.
Code:
eW per36 rates tm Min Eff% Sco Reb Ast PF Stl TO Blk T
.95 Garnett,Kevin Bos 38 .464 18.3 15.2 3.0 2.6 1.7 2.6 1.0 36.9
.85 Pierce,Paul Bos 39 .572 24.5 5.1 6.2 3.9 1.1 3.6 .3 33.8
.75 Allen,Ray Bos 41 .693 22.3 5.4 2.3 2.5 1.2 1.7 .6 30.4
.71 Bryant,Kobe LA 43 .495 21.4 4.1 3.8 2.7 2.3 3.3 .1 28.6
.56 Rondo,Rajon Bos 27 .421 13.2 6.4 9.6 3.1 2.1 2.1 .7 32.5
.52 Gasol,Pau LA 39 .557 14.1 10.1 2.8 3.2 .5 2.1 .5 25.5
.43 Odom,Lamar LA 37 .547 13.8 9.5 2.7 3.9 .3 2.7 1.0 23.9
.21 Radmanovic,Vladi LA 22 .524 12.0 9.0 2.1 6.5 1.2 1.2 .0 22.1
.20 Fisher,Derek LA 31 .551 13.2 1.9 3.4 3.4 1.8 1.8 .0 18.7
.20 Powe,Leon Bos 9 .607 25.1 13.4 .0 7.8 .0 1.2 .0 34.8
.18 Posey,James Bos 25 .765 12.7 5.6 .6 3.3 1.7 1.0 .2 19.5
.13 House,Eddie Bos 13 .516 13.6 4.8 4.1 1.6 .4 .8 .0 22.9
.11 Farmar,Jordan LA 19 .636 12.6 3.3 2.1 2.0 .6 1.4 .9 18.1
.10 Perkins,Kendrick Bos 15 .588 9.5 9.1 .9 9.0 1.3 2.6 2.1 18.7
.05 Vujacic,Sasha LA 22 .505 11.2 3.1 1.1 3.5 .7 1.2 .2 14.5
.05 Ariza,Trevor LA 6 .591 11.4 8.4 .8 5.4 .9 .9 .9 20.9
.02 Cassell,Sam Bos 9 .388 10.1 0.7 3.5 2.3 1.2 1.2 .0 14.9
.02 Brown,Pj Bos 20 .444 5.8 5.9 1.1 5.0 .8 .5 .8 13.4
-.01 Walton,Luke LA 11 .417 6.3 3.0 3.0 6.3 .5 1.4 .5 11.0
-.06 Turiaf,Ronny LA 10 .458 4.5 2.1 .0 6.7 .0 .5 1.5 6.5
Kobe's teammates shot .540 Eff%, while he was .045 lower. Meanwhile he averaged 5 assists and 25 scoring attempts. That's 29% of the shots and 26% of the assists.
Can anyone think of a worse Finals by an MVP ?
See this post:
viewtopic.php?t=1807
_________________
`
36% of all statistics are wrong
Last edited by Mike G on Thu Jun 19, 2008 7:42 am; edited 1 time in total
Back to top
View user's profile Send private message Send e-mail
Ryan J. Parker
Joined: 23 Mar 2007
Posts: 711
Location: Raleigh, NC
PostPosted: Wed Jun 18, 2008 9:20 am Post subject: Reply with quote
Quote:
The stats don't support the mvp choice
It's hard for stats to support anything after just 6 games. Wink
Back to top
View user's profile Send private message Visit poster's website
Mike G
Joined: 14 Jan 2005
Posts: 3630
Location: Hendersonville, NC
PostPosted: Thu Jun 19, 2008 8:51 am Post subject: Reply with quote
Here's a quick chart of who did better/worser in the Finals. Even after standardizing, the participants netted an astonishingly-low 81% of their season rates. I guess this can happen when you pit the 1st and 5th-best defenses.
Kobe didn't actually lead the parade of underachievement by the 2nd-best team. Garnett's .83 Finals/Season performance was actually above the norm.
F/RS is the raw ratio of players' T rates: T(Finals)/T(Season)
X is estimated 'extra' points-produced; divided by 6 (games), it ranks the players here.
So, while Rondo shot poorly, his extra (above his RS) assists (& rebounds, & fewer TO) boosted his T-rate to 118% of his RS T rate. This resulted in an extra 4.7 ppg, relative to the Lakers, in just 27 mpg.
Code:
2008 Finals per36 2007-08 Season
X/6 F/RS Celtics Min Eff% Sco Reb Ast Eff% Sco Reb Ast
4.7 1.18 Rondo,Rajon 27 .421 13.2 6.4 9.6 .505 14.4 5.7 6.3
4.6 1.04 Allen,Ray 41 .693 22.3 5.4 2.3 .572 22.5 4.1 3.1
3.2 .95 Pierce,Paul 39 .572 24.5 5.1 6.2 .579 26.0 5.8 4.6
.6 .92 Powe,Leon 9 .607 25.1 13.4 .0 .601 27.7 11.5 .7
.6 .83 Garnett,Kevin 38 .464 18.3 15.2 3.0 .572 27.1 11.4 3.9
.5 .91 House,Eddie 19 .516 13.6 4.8 4.1 .532 16.7 4.5 3.7
.1 .82 Posey,James 25 .765 12.7 5.6 .6 .574 13.7 7.0 2.3
-.6 .64 Cassell,Sam 10 .388 10.1 0.7 3.5 .454 15.4 4.2 4.3
-.7 .70 Perkins,Kendrick 18 .588 9.5 9.1 .9 .608 14.8 10.3 1.7
-1.2 .64 Brown,PJ 20 .444 5.8 5.9 1.1 .394 5.6 13.4 1.8
X/6 F/RS Lakers Min Eff% Sco Reb Ast Eff% Sco Reb Ast
1.2 .95 Radmanovic,Vladi 22 .524 12.0 9.0 2.1 .576 15.5 5.5 2.7
.5 .84 Odom,Lamar 37 .547 13.8 9.5 2.7 .565 15.1 10.3 3.0
- .3 .79 Fisher,Derek 31 .551 13.2 1.9 3.4 .545 16.9 2.9 3.5
- .9 .70 Farmar,Jordan 19 .636 12.6 3.3 2.1 .557 17.5 4.0 4.2
-1.2 .52 Walton,Luke 11 .417 6.3 3.0 3.0 .499 10.9 6.3 4.1
-2.2 .73 Bryant,Kobe 43 .495 21.4 4.1 3.8 .558 28.9 5.9 4.4
-2.6 .25 Turiaf,Ronny 10 .458 4.5 2.1 .0 .522 13.2 7.9 2.9
-2.7 .54 Vujacic,Sasha 22 .505 11.2 3.1 1.1 .596 21.1 4.4 1.8
-3.8 .66 Gasol,Pau 39 .557 14.1 10.1 2.8 .618 25.4 8.6 3.4
Several of these Lakers didn't shoot a whole lot worse; they just didn't get many shots.
_________________
`
36% of all statistics are wrong
Back to top
View user's profile Send private message
Joined: 14 Jan 2005
Posts: 3630
Location: Hendersonville, NC
PostPosted: Mon Jun 09, 2008 2:45 pm Post subject: Celtics vs Lakers Reply with quote
Boston 2, LA 0
Code:
eW per36 rates tm Min Eff% Sco Reb Ast Stl TO Blk T
.38 Pierce,Paul Bos 36 .758 35.6 5.2 5.7 1.1 4.3 .5 44.7
.34 Garnett,Kevin Bos 40 .446 19.7 15.9 3.1 1.0 2.4 .5 38.6
.28 Bryant,Kobe LA 41 .486 24.0 3.6 5.4 1.8 3.7 .5 33.4
.24 Rondo,Rajon Bos 39 .432 9.5 6.7 12.3 1.0 2.0 .5 32.0
.22 Gasol,Pau LA 41 .627 15.7 9.3 3.1 .9 .9 .5 29.6
.19 Allen,Ray Bos 43 .610 19.0 5.5 3.4 .5 2.8 .5 26.5
.14 Radmanovic,Vladi LA 24 .529 13.2 12.9 2.6 2.3 .8 .0 31.3
.12 Fisher,Derek LA 36 .545 12.7 2.4 4.0 3.2 1.1 .0 23.9
.10 Powe,Leon Bos 12 .806 31.4 7.0 .0 .0 .0 .0 37.4
.08 Odom,Lamar LA 36 .490 11.6 8.3 1.3 .5 1.1 .0 20.2
.01 Perkins,Kendrick Bos 19 .727 10.0 8.4 1.0 .0 3.0 1.0 15.7
.00 Cassell,Sam Bos 10 .364 8.1 0.0 2.4 2.3 .0 .0 15.1
.00 Brown,PJ Bos 22 .500 4.7 6.6 1.3 .6 .0 .6 14.3
.00 Farmar,Jordan LA 13 .786 12.2 2.3 .0 .0 1.0 1.0 14.1
-.01 Turiaf,Ronny LA 11 .563 9.5 2.7 .0 .0 .0 .0 11.0
-.01 Posey,James Bos 22 .550 6.9 3.7 .0 1.9 1.2 .0 11.8
-.03 Vujacic,Sasha LA 24 .552 9.9 1.4 1.1 .0 1.3 .0 10.3
-.05 Walton,Luke LA 14 .250 1.3 3.3 .8 .0 2.0 .0 2.4
Pierce has the Jordan-like numbers so far, but he's always been a playoff overachiever. Kobe looks more like Arenas or DWade this year.
I posted a Jordan/Kobe career comparison over here:
http://www.apbr.org/forum/viewtopic.php?t=1650
_________________
`
36% of all statistics are wrong
Back to top
View user's profile Send private message Send e-mail
Mike G
Joined: 14 Jan 2005
Posts: 3630
Location: Hendersonville, NC
PostPosted: Wed Jun 11, 2008 9:25 am Post subject: Reply with quote
Celts 2, Lakers 1
Code:
eW per36 rates tm Min Eff% Sco Reb Ast Stl TO Blk T
.50 Bryant,Kobe LA 42 .533 28.4 4.5 3.9 1.8 3.2 .3 37.1
.43 Garnett,Kevin Bos 41 .397 16.8 13.4 3.5 .9 2.5 1.3 34.6
.34 Allen,Ray Bos 42 .670 21.9 5.0 2.8 .6 2.1 .6 29.4
.33 Pierce,Paul Bos 35 .577 23.7 5.6 4.9 1.1 4.0 .4 32.4
.27 Rondo,Rajon Bos 33 .450 11.0 5.5 10.6 .8 2.3 .8 29.5
.27 Gasol,Pau LA 40 .532 13.4 10.2 2.8 .6 1.5 .3 26.4
.15 Fisher,Derek LA 33 .500 11.7 2.9 3.4 2.6 1.1 .0 21.8
.15 Radmanovic,Vladi LA 20 .500 12.7 10.6 2.2 1.8 .6 .0 27.4
.13 Odom,Lamar LA 33 .418 10.3 9.5 2.4 .8 2.6 .4 20.5
.11 Perkins,Kendrick Bos 22 .727 11.3 8.2 1.2 1.7 2.3 1.7 22.3
.10 Vujacic,Sasha LA 25 .679 17.3 2.8 1.2 .0 .9 .4 20.5
.10 Powe,Leon Bos 10 .667 27.0 7.6 .0 .0 .9 .0 32.7
.07 Farmar,Jordan LA 15 .727 12.3 4.4 3.0 .0 .7 1.3 21.3
.05 Posey,James Bos 23 .625 9.4 5.7 .0 1.7 .9 .0 16.6
.02 Cassell,Sam Bos 9 .333 9.1 0.0 4.0 2.0 .0 .0 17.6
.02 House,Eddie Bos 7 .375 8.1 4.7 3.0 1.4 .0 .0 18.8
.00 Brown,PJ Bos 20 .423 5.1 5.7 1.0 .5 .9 .9 12.3
.00 Ariza,Trevor LA 5 .500 7.0 5.6 1.5 .0 1.7 .0 12.0
-.02 Turiaf,Ronny LA 13 .500 6.0 1.6 .0 .0 .0 1.5 8.5
-.03 Walton,Luke LA 13 .143 1.0 5.0 2.1 .0 1.5 .8 7.2
Suddenly:
Kobe's the only superstar.
Garnett can't shoot at all.
Ray is 6 months younger.
Pierce is just Pierce.
Rondo is Johnny Moore.
Radman is Rodman.
_________________
`
36% of all statistics are wrong
Back to top
View user's profile Send private message Send e-mail
Mike G
Joined: 14 Jan 2005
Posts: 3630
Location: Hendersonville, NC
PostPosted: Fri Jun 13, 2008 9:37 am Post subject: Reply with quote
Celtics 3, Lakers 1
It's dreadfully premature, but who can be mvp of these Finals?
- Kobe's team doesn't look like it's going to win.
- Garnett's shooting is worse than any Finals mvp could be.
- Ray hardly sits, hardly misses; but doesn't really dominate anywhere.
- Pierce has been hot and cold, racks up TO and fouls.
The big final game will decide.
Code:
eW per36 rates tm Min Eff% Sco Reb Ast Stl TO Blk T
.63 Bryant,Kobe LA 43 .502 24.4 4.1 4.9 2.2 2.8 .2 33.6
.59 Garnett,Kevin Bos 40 .422 16.6 13.5 3.5 1.2 2.9 1.2 33.4
.53 Allen,Ray Bos 44 .678 21.2 5.9 2.5 1.1 1.7 .7 29.9
.48 Pierce,Paul Bos 37 .576 23.4 5.3 5.4 1.0 3.9 .5 31.2
.35 Gasol,Pau LA 40 .527 14.2 9.9 2.5 .5 1.9 .2 24.9
.31 Rondo,Rajon Bos 29 .457 11.0 5.2 9.8 .7 2.0 .7 27.5
.26 Odom,Lamar LA 35 .505 13.0 9.4 2.7 .5 2.4 .5 22.8
.19 Radmanovic,Vladi LA 22 .517 12.6 9.4 2.3 1.3 .4 .0 24.7
.18 Fisher,Derek LA 31 .566 14.1 2.2 3.5 2.1 1.8 .0 20.7
.12 Powe,Leon Bos 10 .592 23.6 10.2 .0 .0 1.4 .0 30.5
.10 Posey,James Bos 23 .679 13.5 5.1 .0 1.3 .6 .0 18.7
.10 Perkins,Kendrick Bos 20 .643 10.3 7.6 1.0 1.4 1.9 1.9 19.5
.07 Vujacic,Sasha LA 25 .549 12.9 3.1 1.2 .3 1.0 .3 16.2
.06 Farmar,Jordan LA 17 .559 9.1 4.5 2.5 .0 .5 .9 17.4
.06 House,Eddie Bos 11 .472 10.9 5.3 2.1 .7 .0 .0 19.5
.06 Ariza,Trevor LA 6 .714 13.6 9.7 1.0 1.1 1.1 1.1 25.2
.00 Cassell,Sam Bos 8 .313 6.8 .0 3.3 1.6 .8 .0 11.7
-.01 Brown,PJ Bos 19 .389 4.8 5.7 .8 .8 .8 .8 11.7
-.04 Turiaf,Ronny LA 13 .409 4.2 1.9 .0 .0 .0 1.8 7.3
-.04 Walton,Luke LA 11 .250 2.5 4.4 1.9 .0 2.1 .7 6.3
The non-contributors at the bottom all had their moments in earlier rounds. The Celts' rotation is drifting back to the successful one we saw earlier: less Sam and PJ, more of House.
_________________
`
36% of all statistics are wrong
Back to top
View user's profile Send private message Send e-mail
Ryan J. Parker
Joined: 23 Mar 2007
Posts: 711
Location: Raleigh, NC
PostPosted: Fri Jun 13, 2008 9:48 am Post subject: Reply with quote
Quote:
It's dreadfully premature, but who can be mvp of these Finals?
If the Celtics win, then my vote goes to the theory of: "...had Pierce not come back in game 1...". So Pierce, of course.
Back to top
View user's profile Send private message Visit poster's website
94by50
Joined: 01 Jan 2006
Posts: 499
Location: Phoenix
PostPosted: Fri Jun 13, 2008 3:36 pm Post subject: Reply with quote
I suspect Pierce will win by default (if no one stands out, pick the top scorer).
Back to top
View user's profile Send private message
Mike G
Joined: 14 Jan 2005
Posts: 3630
Location: Hendersonville, NC
PostPosted: Sat Jun 14, 2008 1:03 pm Post subject: Reply with quote
Round-by-round, the primary Celtics. 'e480' is equivalent-wins generated per 480 minutes. A rate of 1.00 is average for a series. After 4 games of the Finals. Productions are per36, standardized :
Code:
Bos Allen,Ray
vs e480 Min Eff% Sco Reb Ast PF Stl TO Blk 3s T
Atl 1.06 38 .536 18.7 3.7 3.0 2.2 .7 .8 .3 18 26.7
Cle .55 37 .451 11.0 3.8 2.5 2.1 .9 1.6 .3 4 17.0
Det 1.14 36 .574 19.9 4.6 3.1 2.9 .8 1.7 .0 11 25.2
LA 1.47 44 .678 21.2 5.9 2.5 2.2 1.1 1.7 .7 12 29.9
Bos Garnett,Kevin
vs e480 Min Eff% Sco Reb Ast PF Stl TO Blk 3s T
Atl 2.26 37 .529 25.0 9.9 3.8 3.0 2.0 2.0 1.4 1 42.3
Cle 2.09 39 .571 22.8 12.1 3.5 2.5 .8 1.1 1.0 0 40.1
Det 2.37 38 .573 24.4 11.9 2.9 3.0 .8 2.7 .9 1 36.4
LA 1.77 40 .422 16.6 13.5 3.5 2.1 1.2 2.9 1.2 0 33.4
Bos Pierce,Paul
vs e480 Min Eff% Sco Reb Ast PF Stl TO Blk 3s T
Atl 1.77 33 .555 24.7 5.7 5.1 3.9 1.3 2.5 .2 15 36.0
Cle 1.47 38 .521 23.9 5.7 3.7 3.4 1.1 3.4 .1 11 30.9
Det 1.08 43 .590 18.4 6.3 3.2 2.4 .7 2.8 .6 6 24.6
LA 1.59 37 .576 23.4 5.3 5.4 4.4 1.0 3.9 .5 7 31.2
Bos Rondo,Rajon
vs e480 Min Eff% Sco Reb Ast PF Stl TO Blk 3s T
Atl 1.63 31 .482 15.3 5.6 8.6 3.4 2.0 1.2 .2 1 34.2
Cle 1.38 31 .484 15.8 5.7 7.6 3.5 1.7 3.1 .5 3 29.5
Det .66 39 .393 9.5 5.2 6.1 3.2 2.2 2.0 .2 1 20.7
LA 1.28 29 .457 11.0 5.2 9.8 2.9 .7 2.0 .7 0 27.5
Bos Perkins,Kendrick
vs e480 Min Eff% Sco Reb Ast PF Stl TO Blk 3s T
Atl 1.40 24 .671 16.7 11.0 .4 4.8 .9 1.1 2.6 0 31.1
Cle .54 25 .473 8.9 8.3 1.3 5.3 .6 3.2 1.7 0 16.9
Det 1.31 32 .667 12.1 13.6 .6 4.4 1.0 1.0 1.3 0 26.7
LA .61 20 .643 10.3 7.6 1.0 7.7 1.4 1.9 1.9 0 19.5
Bos Posey,James
vs e480 Min Eff% Sco Reb Ast PF Stl TO Blk 3s T
Atl 1.13 23 .591 14.2 7.1 2.1 3.2 1.9 .6 1.1 11 27.6
Cle .35 21 .621 7.3 4.9 1.5 2.7 .9 .5 .2 7 14.1
Det .85 19 .531 13.5 7.3 2.5 5.3 1.4 1.1 .4 5 22.5
LA .54 23 .679 13.5 5.1 .0 3.6 1.3 .6 .0 8 18.7
These 6 are actually the only Celtics to be in the steady rotation. Everyone else has been forgotten at one time or another in these playoffs.
Garnett has been the Celts' most important player in every round.
Here are the Lakers:
Code:
LA Bryant,Kobe
vs e480 Min Eff% Sco Reb Ast PF Stl TO Blk 3s T
Den 2.58 39 .583 34.4 4.8 5.1 3.3 1.4 2.6 1.4 10 46.6
Uta 2.20 41 .607 30.4 7.5 6.2 3.0 .8 3.7 .2 5 41.8
SA 2.33 40 .582 29.4 5.4 3.1 1.2 1.4 2.1 .0 8 36.1
Bos 1.79 43 .502 24.4 4.1 4.9 3.0 2.2 2.8 .2 2 33.6
LA Gasol,Pau
vs e480 Min Eff% Sco Reb Ast PF Stl TO Blk 3s T
Den 1.93 40 .622 23.5 8.1 4.0 1.6 .0 1.4 2.5 0 38.1
Uta 1.40 43 .572 15.8 8.6 3.5 3.0 .5 2.6 2.7 0 29.8
SA 1.62 37 .468 14.7 10.3 3.2 2.5 1.0 1.6 1.6 0 29.6
Bos 1.06 40 .527 14.2 9.9 2.5 3.3 .5 1.9 .2 0 24.9
LA Odom,Lamar
vs e480 Min Eff% Sco Reb Ast PF Stl TO Blk 3s T
Den 1.25 35 .443 12.1 10.0 4.5 3.7 1.6 1.6 .5 0 29.1
Uta 1.44 43 .630 15.3 12.1 1.7 3.0 .8 1.7 1.8 2 30.4
SA 1.36 34 .471 15.9 11.6 2.8 3.3 .2 3.1 1.5 0 27.2
Bos .89 35 .505 13.0 9.4 2.7 4.3 .5 2.4 .5 0 22.8
LA Fisher,Derek
vs e480 Min Eff% Sco Reb Ast PF Stl TO Blk 3s T
Den .53 32 .531 9.8 4.0 2.5 3.7 1.7 .6 .6 6 19.6
Uta .98 35 .746 14.9 2.3 2.9 3.1 3.9 1.3 .2 11 23.5
SA .11 27 .449 9.8 4.0 1.5 4.2 1.9 .6 .0 2 15.6
Bos .71 31 .566 14.1 2.2 3.5 3.0 2.1 1.8 .0 2 20.7
LA Radmanovic,Vladi
vs e480 Min Eff% Sco Reb Ast PF Stl TO Blk 3s T
Den .82 25 .423 11.7 7.0 4.0 3.4 .8 1.5 .4 7 23.5
Uta .52 21 .583 12.7 3.7 1.6 3.8 1.2 1.7 .0 9 16.6
SA .46 26 .677 14.0 7.0 1.6 3.5 .9 2.0 .0 3 18.9
Bos 1.05 22 .517 12.6 9.4 2.3 6.3 1.3 .4 .0 7 24.7
LA Vujacic,Sasha
vs e480 Min Eff% Sco Reb Ast PF Stl TO Blk 3s T
Den .86 19 .674 19.8 2.4 1.3 3.2 .9 1.4 .5 8 24.0
Uta .37 20 .615 10.7 3.5 .8 2.6 .4 .9 .2 9 14.3
SA .09 26 .453 11.4 4.9 1.1 3.2 1.5 1.8 .3 6 15.5
Bos .33 25 .549 12.9 3.1 1.2 4.0 .3 1.0 .3 7 16.2
LA Farmar,Jordan
vs e480 Min Eff% Sco Reb Ast PF Stl TO Blk 3s T
Den .37 17 .446 11.2 3.0 4.0 2.6 .5 2.0 .0 2 17.6
Uta -.26 13 .204 2.4 2.3 1.3 2.5 .6 1.1 .0 1 4.9
SA .83 20 .560 18.4 3.8 1.8 2.3 .8 1.5 .4 5 22.3
Bos .43 17 .559 9.1 4.5 2.5 .9 .0 .5 .9 5 17.4
LA Walton,Luke
vs e480 Min Eff% Sco Reb Ast PF Stl TO Blk 3s T
Den 2.30 25 .757 30.6 7.2 5.0 4.2 .7 2.1 .3 4 43.0
Uta .18 18 .476 6.6 3.2 2.2 4.2 1.2 1.6 .5 3 11.6
SA 1.11 16 .421 13.4 9.2 4.1 2.9 1.5 2.0 .0 2 24.9
Bos -.49 11 .250 2.5 4.4 1.9 4.2 .0 2.1 .7 1 6.3
Several guys with serious ups and downs.
Walton has been as good as Kobe and as bad as anyone.
_________________
`
36% of all statistics are wrong
Last edited by Mike G on Tue Jun 17, 2008 5:18 am; edited 1 time in total
Back to top
View user's profile Send private message Send e-mail
Mike G
Joined: 14 Jan 2005
Posts: 3630
Location: Hendersonville, NC
PostPosted: Mon Jun 16, 2008 8:25 am Post subject: Reply with quote
Bos 3, LA 2
Code:
eW per36 rates tm Min Eff% Sco Reb Ast Stl TO Blk T
.77 Bryant,Kobe LA 43 .504 23.6 4.6 4.5 2.6 3.2 .2 32.6
.73 Pierce,Paul Bos 39 .585 25.9 5.2 5.4 1.0 3.8 .4 33.6
.65 Garnett,Kevin Bos 38 .432 15.7 14.1 2.8 1.4 3.1 1.0 31.6
.55 Gasol,Pau LA 40 .550 15.0 10.4 3.0 .5 1.5 .5 28.0
.54 Allen,Ray Bos 43 .644 19.4 5.1 2.3 .9 1.7 .7 26.7
.42 Odom,Lamar LA 36 .578 15.2 9.7 2.4 .4 2.7 1.2 25.6
.31 Rondo,Rajon Bos 26 .407 9.8 5.2 9.4 .9 2.3 .9 25.9
.24 Radmanovic,Vladi LA 21 .528 13.4 9.9 2.6 1.4 1.4 .0 25.2
.23 Fisher,Derek LA 32 .542 14.5 2.3 3.2 2.1 1.9 .0 20.6
.17 Powe,Leon Bos 9 .592 24.8 12.7 .0 .0 1.5 .0 33.7
.11 Farmar,Jordan LA 18 .577 11.4 4.1 2.4 .4 .4 1.1 20.0
.11 Posey,James Bos 25 .683 11.7 5.8 .5 1.3 1.0 .0 17.7
.10 Perkins,Kendrick Bos 16 .643 10.3 7.8 1.0 1.5 2.0 2.0 19.6
.07 House,Eddie Bos 12 .500 12.3 4.9 2.7 .5 1.1 .0 19.4
.07 Ariza,Trevor LA 5 .714 14.6 10.6 1.1 1.2 1.2 1.2 27.1
.04 Vujacic,Sasha LA 24 .473 10.9 3.1 1.0 .6 .9 .3 14.3
.02 Cassell,Sam Bos 10 .388 10.4 0.7 3.7 1.2 1.2 .0 15.3
-.03 Brown,PJ Bos 20 .391 4.7 5.7 .6 .6 .6 .6 10.9
-.05 Walton,Luke LA 10 .292 3.3 4.0 2.8 .0 1.9 .6 7.5
-.05 Turiaf,Ronny LA 10 .409 4.6 2.1 .0 .0 .6 1.9 6.8
Farmar is the 5th-best shotblocker in these Finals.
In eWins, it's Bos 2.70, LA 2.30 .
_________________
`
36% of all statistics are wrong
Back to top
View user's profile Send private message Send e-mail
Mike G
Joined: 14 Jan 2005
Posts: 3630
Location: Hendersonville, NC
PostPosted: Wed Jun 18, 2008 8:22 am Post subject: Reply with quote
The stats don't support the mvp choice, unless you figure Pierce had much to do with Kobe's suppression.
Code:
eW per36 rates tm Min Eff% Sco Reb Ast PF Stl TO Blk T
.95 Garnett,Kevin Bos 38 .464 18.3 15.2 3.0 2.6 1.7 2.6 1.0 36.9
.85 Pierce,Paul Bos 39 .572 24.5 5.1 6.2 3.9 1.1 3.6 .3 33.8
.75 Allen,Ray Bos 41 .693 22.3 5.4 2.3 2.5 1.2 1.7 .6 30.4
.71 Bryant,Kobe LA 43 .495 21.4 4.1 3.8 2.7 2.3 3.3 .1 28.6
.56 Rondo,Rajon Bos 27 .421 13.2 6.4 9.6 3.1 2.1 2.1 .7 32.5
.52 Gasol,Pau LA 39 .557 14.1 10.1 2.8 3.2 .5 2.1 .5 25.5
.43 Odom,Lamar LA 37 .547 13.8 9.5 2.7 3.9 .3 2.7 1.0 23.9
.21 Radmanovic,Vladi LA 22 .524 12.0 9.0 2.1 6.5 1.2 1.2 .0 22.1
.20 Fisher,Derek LA 31 .551 13.2 1.9 3.4 3.4 1.8 1.8 .0 18.7
.20 Powe,Leon Bos 9 .607 25.1 13.4 .0 7.8 .0 1.2 .0 34.8
.18 Posey,James Bos 25 .765 12.7 5.6 .6 3.3 1.7 1.0 .2 19.5
.13 House,Eddie Bos 13 .516 13.6 4.8 4.1 1.6 .4 .8 .0 22.9
.11 Farmar,Jordan LA 19 .636 12.6 3.3 2.1 2.0 .6 1.4 .9 18.1
.10 Perkins,Kendrick Bos 15 .588 9.5 9.1 .9 9.0 1.3 2.6 2.1 18.7
.05 Vujacic,Sasha LA 22 .505 11.2 3.1 1.1 3.5 .7 1.2 .2 14.5
.05 Ariza,Trevor LA 6 .591 11.4 8.4 .8 5.4 .9 .9 .9 20.9
.02 Cassell,Sam Bos 9 .388 10.1 0.7 3.5 2.3 1.2 1.2 .0 14.9
.02 Brown,Pj Bos 20 .444 5.8 5.9 1.1 5.0 .8 .5 .8 13.4
-.01 Walton,Luke LA 11 .417 6.3 3.0 3.0 6.3 .5 1.4 .5 11.0
-.06 Turiaf,Ronny LA 10 .458 4.5 2.1 .0 6.7 .0 .5 1.5 6.5
Kobe's teammates shot .540 Eff%, while he was .045 lower. Meanwhile he averaged 5 assists and 25 scoring attempts. That's 29% of the shots and 26% of the assists.
Can anyone think of a worse Finals by an MVP ?
See this post:
viewtopic.php?t=1807
_________________
`
36% of all statistics are wrong
Last edited by Mike G on Thu Jun 19, 2008 7:42 am; edited 1 time in total
Back to top
View user's profile Send private message Send e-mail
Ryan J. Parker
Joined: 23 Mar 2007
Posts: 711
Location: Raleigh, NC
PostPosted: Wed Jun 18, 2008 9:20 am Post subject: Reply with quote
Quote:
The stats don't support the mvp choice
It's hard for stats to support anything after just 6 games. Wink
Back to top
View user's profile Send private message Visit poster's website
Mike G
Joined: 14 Jan 2005
Posts: 3630
Location: Hendersonville, NC
PostPosted: Thu Jun 19, 2008 8:51 am Post subject: Reply with quote
Here's a quick chart of who did better/worser in the Finals. Even after standardizing, the participants netted an astonishingly-low 81% of their season rates. I guess this can happen when you pit the 1st and 5th-best defenses.
Kobe didn't actually lead the parade of underachievement by the 2nd-best team. Garnett's .83 Finals/Season performance was actually above the norm.
F/RS is the raw ratio of players' T rates: T(Finals)/T(Season)
X is estimated 'extra' points-produced; divided by 6 (games), it ranks the players here.
So, while Rondo shot poorly, his extra (above his RS) assists (& rebounds, & fewer TO) boosted his T-rate to 118% of his RS T rate. This resulted in an extra 4.7 ppg, relative to the Lakers, in just 27 mpg.
Code:
2008 Finals per36 2007-08 Season
X/6 F/RS Celtics Min Eff% Sco Reb Ast Eff% Sco Reb Ast
4.7 1.18 Rondo,Rajon 27 .421 13.2 6.4 9.6 .505 14.4 5.7 6.3
4.6 1.04 Allen,Ray 41 .693 22.3 5.4 2.3 .572 22.5 4.1 3.1
3.2 .95 Pierce,Paul 39 .572 24.5 5.1 6.2 .579 26.0 5.8 4.6
.6 .92 Powe,Leon 9 .607 25.1 13.4 .0 .601 27.7 11.5 .7
.6 .83 Garnett,Kevin 38 .464 18.3 15.2 3.0 .572 27.1 11.4 3.9
.5 .91 House,Eddie 19 .516 13.6 4.8 4.1 .532 16.7 4.5 3.7
.1 .82 Posey,James 25 .765 12.7 5.6 .6 .574 13.7 7.0 2.3
-.6 .64 Cassell,Sam 10 .388 10.1 0.7 3.5 .454 15.4 4.2 4.3
-.7 .70 Perkins,Kendrick 18 .588 9.5 9.1 .9 .608 14.8 10.3 1.7
-1.2 .64 Brown,PJ 20 .444 5.8 5.9 1.1 .394 5.6 13.4 1.8
X/6 F/RS Lakers Min Eff% Sco Reb Ast Eff% Sco Reb Ast
1.2 .95 Radmanovic,Vladi 22 .524 12.0 9.0 2.1 .576 15.5 5.5 2.7
.5 .84 Odom,Lamar 37 .547 13.8 9.5 2.7 .565 15.1 10.3 3.0
- .3 .79 Fisher,Derek 31 .551 13.2 1.9 3.4 .545 16.9 2.9 3.5
- .9 .70 Farmar,Jordan 19 .636 12.6 3.3 2.1 .557 17.5 4.0 4.2
-1.2 .52 Walton,Luke 11 .417 6.3 3.0 3.0 .499 10.9 6.3 4.1
-2.2 .73 Bryant,Kobe 43 .495 21.4 4.1 3.8 .558 28.9 5.9 4.4
-2.6 .25 Turiaf,Ronny 10 .458 4.5 2.1 .0 .522 13.2 7.9 2.9
-2.7 .54 Vujacic,Sasha 22 .505 11.2 3.1 1.1 .596 21.1 4.4 1.8
-3.8 .66 Gasol,Pau 39 .557 14.1 10.1 2.8 .618 25.4 8.6 3.4
Several of these Lakers didn't shoot a whole lot worse; they just didn't get many shots.
_________________
`
36% of all statistics are wrong
Back to top
View user's profile Send private message
Re: Recovered old threads- miscellaneous topics
schtevie
Joined: 18 Apr 2005
Posts: 407
PostPosted: Fri Aug 01, 2008 10:40 am Post subject: Who ya gonna believe... Reply with quote
I am a bit surprised that no one here has chosen the Artest trade as a topic of conversation. Let me do so, as the apparent uber-advocate of Adj.+/-, because I think it may lead to some interesting results, at variance with what appears to be the conventional wisdom.
Ron Artest in Adj.+/- world is an elite player, a true superstar, a HOFer. Taking an unweighted average of such publicly available measures, he sits at #12. This status is much higher than the general appraisal of his worth by the public and media. And by this measure, Houston fleeced Sacramento.
May I propose that we do a round of predictions of how Houston will perform next year? Could someone who is better informed suggest a likely distribution of minutes, given how its roster is currently comprised?
As a first take, from my perspective, the gains to Houston from this trade should be significant, likely enough to make Houston the favorite coming out of the West. This arises both from the essentially certain (one of the reasons for Artest's greatness being his consistency...when playing that is) and significant positive Adj+/- on Artest's account, and the elimination of some of the negative contribution of Jackson. Possibly moderating the former gain is that Artest's minutes will likely be taken away from Scola and Landry, who on one year's data were net positive contributors.
Finally, let me quibble with the lede of Hollinger's recent opining on the subject. What Adj.+/- suggests is that the gain to the Rockets will come from what is Artest's strength: defense. He is a poor man's (?) Kevin Garnett, where the whole of his positive contribution last year is attributed to the defensive end. Yes, both put a bunch of points on the board, but the apparent offensive contribution was but an illusion (if the estimates happened to be precise). And why should things be different next season? Just because the Rockets were already good defensively, is no reason they cannot be better. What you have seen is likely what you will get. (With the minor, intriguing caveat that Artest's boffo Adj.+/- year - plausibly attributable to better offensive performance - was his happy year with Rick Adelman.)
Contrariwise, the better (Adj.+/-) frame for considering the upcoming season is whether McGrady and Ming can step up and regain their form, one which Artest has never lost.
Back to top
View user's profile Send private message
Harold Almonte
Joined: 04 Aug 2006
Posts: 616
PostPosted: Fri Aug 01, 2008 11:26 am Post subject: Reply with quote
I think Artest was taken in order to reinforce the perimeter defense to increase protection of Yao who comes from an injury of consideration. The scoring help is an extra bonus Battier doesn't give, because HOU was in a scoring state of emergency last year, even with the TMac reborn. To say that Artest was a more effective scorer than three of HOU starters, includding one of its first scoring option...
Back to top
View user's profile Send private message
Ilardi
Joined: 15 May 2008
Posts: 262
Location: Lawrence, KS
PostPosted: Fri Aug 01, 2008 11:42 am Post subject: Reply with quote
Yes, Artest has been an elite player from an adj. +/- standpoint for several seasons now. He's only 28, so one wouldn't typically expect any age-related performance dropoff.
Add him to a Houston team that had a +4.7 ppg differential last year, and the Rockets should achieve at least a +8.0 differential for 08-09: good for 60+ wins and the #1 seed in the West.
Back to top
View user's profile Send private message
Kevin Pelton
Site Admin
Joined: 30 Dec 2004
Posts: 976
Location: Seattle
PostPosted: Fri Aug 01, 2008 11:42 am Post subject: Re: Who ya gonna believe... Reply with quote
schtevie wrote:
What Adj.+/- suggests is that the gain to the Rockets will come from what is Artest's strength: defense. He is a poor man's (?) Kevin Garnett, where the whole of his positive contribution last year is attributed to the defensive end.
Eli's version of offensive and defensive adjusted plus-minus suggests this, but it's worth noting that Artest doesn't appear in Dan's defensive top 10 despite overall strong adjusted net plus-minus numbers. So I would say the offensive/defensive balance is not entirely clear.
Also, and this is more of a quibble, a player with an offensive adjusted plus-minus of 0 still makes contributions on offense to the extent that value is best compared to replacement level, not average.
Quote:
(With the minor, intriguing caveat that Artest's boffo Adj.+/- year - plausibly attributable to better offensive performance - was his happy year with Rick Adelman.)
And that it's gone down significantly each of the last two seasons, which may not mean anything but counters the highly positive tone of your post.
The bigger issue remains fit. We have plenty of data on Artest's play on small forward, but power forward is a different issue.
Back to top
View user's profile Send private message Send e-mail Visit poster's website
deepak
Joined: 26 Apr 2006
Posts: 664
PostPosted: Fri Aug 01, 2008 11:47 am Post subject: Reply with quote
I'm not going to venture into win predictions, because I'm not stats-savvy enough to try it.
But I'm familiar enough with the team to where I can take a stab at the minutes distribution. The inclusion of Artest seems to crowd things a lot. I frankly don't see how he, Battier, and the Rockets PFs will get the minutes they should otherwise deserve. Below represents my subjective expected minutes played for each player, per position, assuming all players are available (including a resigned Mutombo and Landry who are right now question marks).
Code:
pos player min
-------------------------
1 Alston 33
1 Brooks 12
1 Barry 3
-------------------------
2 McGrady 30
2 Barry 15
2 Head 3
-------------------------
3 Artest 20
3 Battier 25
3 McGrady 3
-------------------------
4 Scola 15
4 Landry 20
4 Artest 10
4 Hayes 3
-------------------------
5 Yao 34
5 Scola 10
5 Mutombo 4
-------------------------
Back to top
View user's profile Send private message
Ben F.
Joined: 07 Mar 2005
Posts: 391
PostPosted: Fri Aug 01, 2008 12:11 pm Post subject: Reply with quote
Something else to consider if Artest is indeed going to spend most of his time at PF: his rebounding. According to my numbers last year his defensive rebounding percentage was right around 10%, whether he was at PF or SF. The difference between that and what Landry/Scola/Hayes did last year is about 6-7%. If we assume that changes in player defensive rebounding make about 1/3rd of the impact on the team level (as various investigations on diminishing returns suggest) that's a difference in team DR% of about 2.5%. That seems small until you realize it's the difference between #7 in the league (where Houston was last year) and #22 in defensive rebounding.
Now, Artest probably isn't going to play all of his minutes at PF, and it could easily be that the gains on the offensive end from the spacing that Artest at PF brings more than cancel out the worse defensive rebounding. But it still is something to watch for.
Back to top
View user's profile Send private message
Ryan J. Parker
Joined: 23 Mar 2007
Posts: 708
Location: Raleigh, NC
PostPosted: Fri Aug 01, 2008 1:04 pm Post subject: Reply with quote
Quote:
whether he was at PF or SF
I don't want to hijack this thread, but has anyone come up with a good way of identifying where a player fits into a given lineup? Dougstats has positions, but what do we do for the unit that he has the largest number of possessions with?
From basketball value:
Quote:
Artest, Ron - Martin, Kevin - Miller, Brad - Moore, Mikki - Udrih, Beno
This unit took part in 756 offensive and 762 defensive possessions. The categorization from dougstats.com is as follows:
Quote:
Artest=SF, Martin=SG, Miller=C, Moore=C, Udrih=PG
So back to my original question: who is PF in this lineup? Can we do better than saying that Pr(Miller is PF) = 0.5 and Pr(Moore is PF) = 0.5?
I haven't really tried to investigate this too much yet, but it seems the best time to ask given the discussion.
Back to top
View user's profile Send private message Visit poster's website
Ben F.
Joined: 07 Mar 2005
Posts: 391
PostPosted: Fri Aug 01, 2008 2:14 pm Post subject: Reply with quote
Ryan J. Parker wrote:
I don't want to hijack this thread, but has anyone come up with a good way of identifying where a player fits into a given lineup?
I had posted about the method I used in a previous thread, here is my description:
Quote:
I decided to go through the list of every NBA player who played last year and assign a role among the following 6 categories: PG, combo guard, wing, forward, post, C. In my mind those are really the 6 main player types in the NBA: a point guard, someone who is short enough to play PG but is really still a scorer so that when paired with another bigger PG he'd still be an SG (think Allen Iverson), a wing player (someone who can slide between SG/SF), a forward (someone who's an SF/PF, a la Shawn Marion), a post player (basically a PF/C), and a center (someone who is the center regardless of height - think Kendrick Perkins as the C even when KG is on the court). You can then sort any lineup positionally by ordering them according to those positions, with height/weight being the tiebreaker. So if a team had 3 "PG"s on the court, the assigned PG would be the smallest player, the assigned SG the second smallest, etc.
Obviously it's still decently subjective, but because it uses actual lineups I think it does a better job than most methods. You can see the results for this past year here. There may well be mistakes in classification, but I think it's pretty accurate for the overwhelming number of players.
Ryan J. Parker wrote:
From basketball value:
Quote:
Artest, Ron - Martin, Kevin - Miller, Brad - Moore, Mikki - Udrih, Beno
This unit took part in 756 offensive and 762 defensive possessions. The categorization from dougstats.com is as follows:
Quote:
Artest=SF, Martin=SG, Miller=C, Moore=C, Udrih=PG
So back to my original question: who is PF in this lineup? Can we do better than saying that Pr(Miller is PF) = 0.5 and Pr(Moore is PF) = 0.5?
Since both are listed at 7-0 according to NBA.com (and both at 6-11 according to B-R.com) but Brad Miller weighs about 40 pounds more my method would classify him as the center.
Still, that doesn't really effect the analysis of Artest, who it looks like would flip between SF when the Moore/Miller combo was on the floor and PF when it was not.
Back to top
View user's profile Send private message
Ryan J. Parker
Joined: 23 Mar 2007
Posts: 708
Location: Raleigh, NC
PostPosted: Fri Aug 01, 2008 2:30 pm Post subject: Reply with quote
Ben, that is just what I was looking for. Clearly error is involved regardless, but that method looks like it would reduce it the most. I think this will give me just what I'm looking for when used in combination with dougstats. If a "well defined" lineup isn't in place according to dougstats, then this can be used to try to classify missing and/or overlapping positions.
Back to top
View user's profile Send private message Visit poster's website
Mountain
Joined: 13 Mar 2007
Posts: 1527
PostPosted: Fri Aug 01, 2008 8:58 pm Post subject: Reply with quote
I mentioned the issue of Artest's raw +/- splits at PF and SF in another thread. I didn't feel like taking the lead in making it a new topic at the time but it is good there is interest in doing so.
Deepak's minutes projection might be close to what happens though PF is crowded and could change and PG should change in my opinion.
McGrady / Battier together works well for the Rockets especially on +/- (though less so last season compared to 06-07) and we'll probably see a lot more of that. They win a bit less together than apart on raw +/-, though the level of opponents faced probably varies in these splits with together likely facing more starters. Maybe there are some types of opponent match-ups where it is less good and a better option might now be available.
I wonder if we will see a lot of Barry / Artest together as their replacements. That would be positive on adjusted +/- for Barry paired with positive on defense for Artest.
Would McGrady / Artest and Barry / Battier work better? Try all the combos and see how they work with different bigs and different PGs. Lots of match-up capability and Adelman should do well with the resources.
Last edited by Mountain on Sat Aug 02, 2008 10:12 am; edited 1 time in total
Back to top
View user's profile Send private message
schtevie
Joined: 18 Apr 2005
Posts: 407
PostPosted: Sat Aug 02, 2008 8:22 am Post subject: Reply with quote
Kevin, allow me to quibble with your quibbles.
First, I did consult but not note Dan's originally provided Defensive Adj.+/- data, only because the relevant data was missing. His article shows top and bottom ten players by position, sorted by Overall +/-, not Adj. +/-. Now, it may be that Artest is not in the latter top ten, but if you look at the missing Adj.+/- percentiles in the list provided, he may well be (and these are the years when he was considered 1st Team NBA on Defense, I think.)
Next quibble, why would one want to compare offensive (or defensive or overall) Adj.+/- contributions to replacement level players? Conceptually, it makes no sense, as the benchmark should be whether a player contributes to winning or losing, i.e. a +/- of 0. And second, the benchmark you suggest bounces around from year to year and depends on the definition of a replacement level player. What is the utility in that?
Third quibble, a semi-quibble. You are correct in noting that Artest's productivity has decreased the past three years. Dropping from his all-time high of 11.83 to his lowest ever posting of about 5. It is not clear whether this is noise, given that he is still in his demographic prime, or a trend. We shall see. (Not that 5 is bad, of course. To the contrary, if real, it is very good, and should give Houston the aforementioned bump.) However, you neglect to note that the same "trend" exists with McGrady and Ming, and this is even more pronounced. Again, the Adj.+/- frame to the Houston story has nothing to do with how "ghetto" Artest is and everything to do with whether McGrady and Ming can return to form. Artest is a huge asset, period (well, barring freak-outs.)
As for your final comment on the importance of fit, that is a very interesting issue. It would be cool to know how Adj.+/- is influenced by player position, and maybe such a project can go in Steve's in box.
Back to top
View user's profile Send private message
Mountain
Joined: 13 Mar 2007
Posts: 1527
PostPosted: Sat Aug 02, 2008 10:47 am Post subject: Reply with quote
Over past 2 seasons Artest was best - on raw +/- with scoring big Brad Miller (and in 06-07 with C Willliamson) and worst with perimeter scorer Salmons (and in 06-07 also low with K Martin). But that was consistent with the overall average team results of playing with those players so it might not be indicative on any general type compatability trend for Artest. Still looking back further Artest was above his average when playing with the leading bigs in Sacramento in 05-06 and Indiana in 03-04.
Last season no Artest as PF lineup - used over 50 minutes was better than +1 on raw +/-. His best lineups were when paired with 2 7 footers in Miller/Moore.
Maybe Artest will do well with Yao or Scola and perhaps especially when that trio is on court together? And maybe pairing with McGrady will be lukewarm ... or less? We'll see if these reaches for clues bear out.
Deepak's minute projection has McGrady / Yao going for 64 minutes per regular season game instead of the 74 combined last season (though not always together). Artest's arrival would make this more feasible and I'd support that and not get swept up in trying for 60+ wins and possibly wearing those 2 out in pursuit of highest playoff seed- especially given their injury history and playoff history. I'd think taking a Spurs like approach and playing your top 2 64 minutes or not much more in the regular season would help some come playoffs.
Back to top
View user's profile Send private message
NickS
Joined: 30 Dec 2004
Posts: 384
PostPosted: Sat Aug 02, 2008 12:20 pm Post subject: Reply with quote
Ilardi wrote:
Add him to a Houston team that had a +4.7 ppg differential last year, and the Rockets should achieve at least a +8.0 differential for 08-09: good for 60+ wins and the #1 seed in the West.
I just want to say that I am a skeptic. I am willing to agree that, if the rockets have a point differential above +6 that I will surprised, and that I would count that as a successful prediction for adjusted +/-.
In this case I don't have a model that I'm looking at, just me general sense of following the league doesn't make me think that the Rockets will be title contenders this season. Call it naive conventional wisdom, but it would be really interesting to me if the quoted prediction comes true.
Back to top
View user's profile Send private message
deepak
Joined: 26 Apr 2006
Posts: 664
PostPosted: Sat Aug 02, 2008 5:46 pm Post subject: Reply with quote
NickS wrote:
In this case I don't have a model that I'm looking at, just me general sense of following the league doesn't make me think that the Rockets will be title contenders this season. Call it naive conventional wisdom, but it would be really interesting to me if the quoted prediction comes true.
Other than health, what do you think the Rockets are missing that keeps them from being contenders? They've shown the last two seasons they can win 50+ games in the regular season with key players missing a large chunk of the season.
Back to top
View user's profile Send private message
cherokee_ACB
Joined: 22 Mar 2006
Posts: 157
PostPosted: Sat Aug 02, 2008 6:03 pm Post subject: Re: Who ya gonna believe... Reply with quote
Kevin Pelton wrote:
... but it's worth noting that Artest doesn't appear in Dan's defensive top 10 despite overall strong adjusted net plus-minus numbers.
You are talking different seasons there. As Dan said here
http://danrosenbaum.blogspot.com/2005/0 ... usted.html
"Remember that Ron Artest did not make this list because he did not play 1,000 minutes last season"
Anyway, his raw on-off data those two seasons point to a bigger impact on defense
http://www.82games.com/03IND7D.HTM
http://www.82games.com/04IND9D.HTM
page 2 missing
page 3
schtevie
Joined: 18 Apr 2005
Posts: 408
PostPosted: Wed Aug 06, 2008 7:48 am Post subject: Reply with quote
Gabe, are you saying that there is no correlation between the APM estimates for teammates?
Back to top
View user's profile Send private message
Ryan J. Parker
Joined: 23 Mar 2007
Posts: 708
Location: Raleigh, NC
PostPosted: Wed Aug 06, 2008 9:42 am Post subject: Reply with quote
Quote:
Call me daft, but I honestly have no idea what this means. How do the words "marginal utility" go with "general topic" and "distinctly positive"?
You're doing better than me. I can't interpret half of what schtevie says. Sad Big words are the death of me!
Back to top
View user's profile Send private message Visit poster's website
gabefarkas
Joined: 31 Dec 2004
Posts: 1313
Location: Durham, NC
PostPosted: Wed Aug 06, 2008 10:24 am Post subject: Reply with quote
schtevie wrote:
Gabe, are you saying that there is no correlation between the APM estimates for teammates?
I don't know what the correlation is, or even if it is negative or positive. Do you?
Back to top
View user's profile Send private message Send e-mail AIM Address
schtevie
Joined: 18 Apr 2005
Posts: 408
PostPosted: Wed Aug 06, 2008 10:55 am Post subject: Reply with quote
Maybe I am thinking about this the wrong way, but my expectation is that the covariance of teammates' APMs would be negative.
And on the other issue, sorry to be obtuse. My point is I enjoy and think there is value in any and all discussions of APM.
Back to top
View user's profile Send private message
Kevin Pelton
Site Admin
Joined: 30 Dec 2004
Posts: 978
Location: Seattle
PostPosted: Wed Aug 06, 2008 10:57 am Post subject: Reply with quote
The adjusted plus-minus for a team in a given season should more or less sum to its point differential, right? In that case, to the extent that adjusted plus-minus for one player is "off," it would be offset in the other direction by other players, right?
I don't think that would make teammates' ratings correlated, but it would indicate that if a team is kept together, our assessment of their overall adjusted plus-minus is more precise.
Does that make sense?
Back to top
View user's profile Send private message Send e-mail Visit poster's website
DLew
Joined: 13 Nov 2006
Posts: 224
PostPosted: Wed Aug 06, 2008 11:56 am Post subject: Reply with quote
Yeah, Kevin and Schtevie are correct. Because adjusted plus-minus fits to team point differential then as the play-minutes in question become a greater percentage of the team minutes the error will decrease. For instance if we considered all of the rockets players except for one low minute guy then that total would be very close to team point differential and we would know the error on that estimate to be low.
Back to top
View user's profile Send private message
gabefarkas
Joined: 31 Dec 2004
Posts: 1313
Location: Durham, NC
PostPosted: Wed Aug 06, 2008 8:07 pm Post subject: Reply with quote
schtevie wrote:
Maybe I am thinking about this the wrong way, but my expectation is that the covariance of teammates' APMs would be negative.
Why? Why couldn't it take the range of all possible values? If two players are on the court together a lot, it seems to me their APMs are going to be fairly strongly dependent on each other, no?
Also, for two players who are now going to be teammates (such as Artest and Rocket Player X), how can you make any statement whatsoever about the potential relationship between their APM? I'm not saying you can't, I'm just asking on what basis you can do so.
Back to top
View user's profile Send private message Send e-mail AIM Address
schtevie
Joined: 18 Apr 2005
Posts: 408
PostPosted: Wed Aug 06, 2008 10:07 pm Post subject: Reply with quote
I wasn't trying to make any statement at all about the expected relationship of APMs between future teammates (such as Artest and Rocket Player X) only current ones. And I am not denying the possibility that the covariance between teammates can take a range of possible values.
But my expectation for any player pair is that the covariance is negative. APM represents apportioned credit for individual line-up +/-s. McGrady and Ming shared the court for half of Ming's minutes and about forty percent of McGrady's. If McGrady's estimate is lower than his true APM, there is a good chance that Ming's is erroneously high, hence my point that there is a good chance that they were collectively mediocre.
Back to top
View user's profile Send private message
gabefarkas
Joined: 31 Dec 2004
Posts: 1313
Location: Durham, NC
PostPosted: Thu Aug 07, 2008 6:05 am Post subject: Reply with quote
schtevie wrote:
Running the Adj.+/- numbers, you see that by merely prorating the minutes of the Rockets players remaining from last year's roster, the team would improve from 4.7 per game to 6+.
This is what you wrote a few days ago (on the previous page). At least to me, this seems to imply that the APMs of their remaining players will likely cause their expected win margin to increase. Is that a correct interpretation?
schtevie wrote:
But my expectation for any player pair is that the covariance is negative. APM represents apportioned credit for individual line-up +/-s. McGrady and Ming shared the court for half of Ming's minutes and about forty percent of McGrady's. If McGrady's estimate is lower than his true APM, there is a good chance that Ming's is erroneously high, hence my point that there is a good chance that they were collectively mediocre.
If the expectation of the covariance for any player pair is negative, meaning one is higher than it "should be" while the other is lower than it "should be", how can you be sure that pooling their APMs will lead to an increase in their expected win margin? More specifically, if one player will likely have a lower APM (in your example, Ming), while the other will likely have a higher APM (in your example, McGrady), how does this lead to the above conclusion regarding their expected win margin?
Back to top
View user's profile Send private message Send e-mail AIM Address
gabefarkas
Joined: 31 Dec 2004
Posts: 1313
Location: Durham, NC
PostPosted: Thu Aug 07, 2008 6:06 am Post subject: Reply with quote
DLew wrote:
Yeah, Kevin and Schtevie are correct. Because adjusted plus-minus fits to team point differential then as the play-minutes in question become a greater percentage of the team minutes the error will decrease. For instance if we considered all of the rockets players except for one low minute guy then that total would be very close to team point differential and we would know the error on that estimate to be low.
So then if a team fielded only 5 players all year, and all 5 played 100% of their minutes together, the error would be 0? Is that what you're implying?
Back to top
View user's profile Send private message Send e-mail AIM Address
schtevie
Joined: 18 Apr 2005
Posts: 408
PostPosted: Thu Aug 07, 2008 9:44 am Post subject: Reply with quote
Gabe, I think you are correctly interpreting my remarks about my baseline calculation for the Rockets in '09. This "addition by subtraction" assumes that the remaining players, who had higher APMs, will maintain this productivity in having their '08 per game minutes reduced but number of games played increased. To the extent that the older players will deteriorate, to the extent that the '08 estimates are imprecise, and to the extent that my assumptions violate NBA 101 in terms of Xs and Os, my estimate is misconceived. Otherwise, I am quite happy with it.
As for your second point, I don't quite understand your concern that notional negative covariances between players undermines the pooled APM estimate, a priori. If it so happens that the players culled from the Rockets roster happened to have APMs lower than their "true" value relative to those that remained, then the pooled estimate of the remaining roster will be to too high. Coversely, if the dumped players are even worse than their estimated APMs, the remaining roster should be expected to be better still. I cannot be sure that pooling APMs will lead to an increasing their expected win margin unless I were to be absolutely sure that those leaving are worse than those staying.
Back to top
View user's profile Send private message
NickS
Joined: 30 Dec 2004
Posts: 384
PostPosted: Thu Aug 07, 2008 10:05 am Post subject: Reply with quote
gabefarkas wrote:
DLew wrote:
Yeah, Kevin and Schtevie are correct. Because adjusted plus-minus fits to team point differential then as the play-minutes in question become a greater percentage of the team minutes the error will decrease. For instance if we considered all of the rockets players except for one low minute guy then that total would be very close to team point differential and we would know the error on that estimate to be low.
So then if a team fielded only 5 players all year, and all 5 played 100% of their minutes together, the error would be 0? Is that what you're implying?
The error for the five of them, taken as a 5-man unit would be zero. The error for each individual player would be impossible to estimate.
I take him as saying that if, in this example, you combined the minutes of T-Mac and Yao into one player, and called that player T-Ming. The error for T-Ming would be lower than the error for either T-Mac or Yao separately, because it's accounting for a greater portion of the total minutes.
Back to top
View user's profile Send private message
DLew
Joined: 13 Nov 2006
Posts: 224
PostPosted: Thu Aug 07, 2008 11:20 am Post subject: Reply with quote
Exactly correct on the first point. If a team had only five players the errors on the individual players would basically be infinite, as we would be unable to determine their coefficients, but the error for those five players together would be zero. This result is never achieved in the NBA, but in evaluating some groups of players within a team it is approached.
In the T-Ming case the coefficient won't necessarily be closer to the true value, but it is very likely that it will be.
Back to top
View user's profile Send private message
Mountain
Joined: 13 Mar 2007
Posts: 1527
PostPosted: Thu Aug 07, 2008 6:34 pm Post subject: Reply with quote
There was a huge swing between 2005-6 and last season for the combined adjusted +/- of TMac-Yao, namely from +21.5 to -0.3. Would the combined estimated error be maybe + or - 6 for each season? That still leaves a long distance (at least 9 pts, a huge per game amount really) to try to understand.
Did they pair really change that much in impact? Did the rotation or role under new coach / system change so much that credit assignment properly shifts substantially away from them to others? (That may not matter if you already know you're sticking with them but it does if you were open to change.) The quality of rest of squad certainly changed a lot but did it really change that much?
Team differential only changed a total of a bit over 6 points. So assuming the perfect storm of TMac-Yao overestimate in 2005-6 and underestimate in 2007-8 the pair might have only gone from +15 to +6 and given the team point differentials the rest of squad might have went from about -16 to -1 to produce a total team +/- transition from -1.6 to +4.7?
It that the best guess of what happened? How confident are people of that? I am not convinced that is what happened but want to consider it fairly. Maybe this an even more extreme circumstance than I outlined.
I saw that in 05-06 TMac and Yao were on the floor together less than half the time and thought that might be part of it but they were only on floor together just under half their minutes this past season too so that much is similar. In 04-05 and 06-07 the % of time together was significantly higher. Maybe those years being together more made the combined +/- estimate more accurate at least for the combo but less certain for the 2 individually? The combined totas were +7 and +8. You could look at the 4 years and average or look at them and throw out 2005-06. Those are probably decent ways to draw a conclusion and move on. The "true" story might be close to that or different.
You could keep looking for more explanation. Maybe in 05-06 when one was out the other picked up much of that stat responsibility and delivered the goods as the rest of cast was less capable of doing so while this past season the rest of cast could and did? Maybe the superstars regressed some too. From age, injury, effort or the league figuring out how to combat particularly the duo. More one without the other in 05-06 and 07-08 might have created a broader distribution of lineups and affected the opportunity for "finding" the value of the second superstar vs the rest of squad. The roster turnover makes it harder to resolve. Tough to say with much confidence at least for me at this point.
Back to top
View user's profile Send private message
gabefarkas
Joined: 31 Dec 2004
Posts: 1313
Location: Durham, NC
PostPosted: Thu Aug 07, 2008 8:43 pm Post subject: Reply with quote
schtevie wrote:
As for your second point, I don't quite understand your concern that notional negative covariances between players undermines the pooled APM estimate, a priori. If it so happens that the players culled from the Rockets roster happened to have APMs lower than their "true" value relative to those that remained, then the pooled estimate of the remaining roster will be to too high. Coversely, if the dumped players are even worse than their estimated APMs, the remaining roster should be expected to be better still. I cannot be sure that pooling APMs will lead to an increasing their expected win margin unless I were to be absolutely sure that those leaving are worse than those staying.
That's my point. We have no way of being sure. Not even close to it.
page 4
schtevie
Joined: 18 Apr 2005
Posts: 409
PostPosted: Fri Aug 08, 2008 1:03 pm Post subject: Reply with quote
Gabe, here are the actual numbers. Prorating minutes per game on the '08 Rockets roster (taking actual MPG, converting these to a possession basis, then applying estimated individual APM statistics) where one group is the positive APM players (except for Yao Ming and Aaron Brooks) and the other group is the negative APM players (except for Kirk Snyder - and one assumes that the players with insufficient minutes get a replacement level value of -2, which makes the team net point differential equal the actual) we get the following:
(1) The "positive" team has an APM of 7.91 and a net point per game equivalent of 7.15.
(2) The "negative" team has an APM of -10.04 and a net point per game equivalent of -9.08.
This compares to an actual APM of 5.2 and net point per game of 4.7.
Setting aside any Xs and Os objection. What exactly are you saying that we cannot be sure about? That 7.15 is not bigger than 4.7? That 7.15 is not bigger than -9.08? And if one is not "sure" about either, from a certain statistical perspective, is it unresonable to say that, all else equal, culling the lower APM guys is likely to be a good idea?
Back to top
View user's profile Send private message
Ilardi
Joined: 15 May 2008
Posts: 263
Location: Lawrence, KS
PostPosted: Fri Aug 08, 2008 1:23 pm Post subject: Reply with quote
schtevie wrote:
Gabe, here are the actual numbers. Prorating minutes per game on the '08 Rockets roster (taking actual MPG, converting these to a possession basis, then applying estimated individual APM statistics) where one group is the positive APM players (except for Yao Ming and Aaron Brooks) and the other group is the negative APM players (except for Kirk Snyder - and one assumes that the players with insufficient minutes get a replacement level value of -2, which makes the team net point differential equal the actual) we get the following:
(1) The "positive" team has an APM of 7.91 and a net point per game equivalent of 7.15.
(2) The "negative" team has an APM of -10.04 and a net point per game equivalent of -9.08.
This compares to an actual APM of 5.2 and net point per game of 4.7.
Setting aside any Xs and Os objection. What exactly are you saying that we cannot be sure about? That 7.15 is not bigger than 4.7? That 7.15 is not bigger than -9.08? And if one is not "sure" about either, from a certain statistical perspective, is it unresonable to say that, all else equal, culling the lower APM guys is likely to be a good idea?
Schtevie,
I certainly wouldn't want to put words in anyone's mouth, but I think the objection might simply be that there's enough noise in the individual player APM (adj +/-) estimates right now to raise doubt about the degree to which 4.7 truly differs from 7.15 at a reasonable confidence level (i.e., that a 95% confidence interval constructed around your high-APM aggregate would probably still include 4.7 at the low end of the interval). If the APM estimates were low-noise (i.e., low SE), then this objection would disappear; but they're not, and it won't (for now).
Of course, in a Bayesian sense, 7.15 still represents our best a priori guess about what your high-APM aggregate will do - and it's a reasonably good guess, to boot - it's just that it's the sort of guess that will sometimes prove to be off by a fair margin.
Back to top
View user's profile Send private message
schtevie
Joined: 18 Apr 2005
Posts: 409
PostPosted: Fri Aug 08, 2008 2:51 pm Post subject: Reply with quote
Steve, I have no disagreements whatsoever with your observations. 4.7 points might, in fact, be outside a 95% confidence interval (my guess - merely a guess - is that it would be close). From the standpoint of GM decision-making, however, it is a Bayesian world.
Finally, note that this digression does not relate to the, presumably positive, effect of Ron Artest, whose prospective contribution (and the likely relative success of an APM approach as a predictive methodology) was the motive for this string.
Back to top
View user's profile Send private message
Ilardi
Joined: 15 May 2008
Posts: 263
Location: Lawrence, KS
PostPosted: Fri Aug 08, 2008 3:56 pm Post subject: Reply with quote
Yes, Artest has been an elite player, based on his adj +/- ratings, for the past 6 years, so there's little doubt: he'll have a net positive impact on the Rockets next season (assuming that he's reasonably healthy and doesn't go postal).
Back to top
View user's profile Send private message
gabefarkas
Joined: 31 Dec 2004
Posts: 1313
Location: Durham, NC
PostPosted: Fri Aug 15, 2008 1:02 pm Post subject: Reply with quote
schtevie wrote:
(1) The "positive" team has an APM of 7.91 and a net point per game equivalent of 7.15.
(2) The "negative" team has an APM of -10.04 and a net point per game equivalent of -9.08.
This compares to an actual APM of 5.2 and net point per game of 4.7.
Setting aside any Xs and Os objection. What exactly are you saying that we cannot be sure about? That 7.15 is not bigger than 4.7? That 7.15 is not bigger than -9.08? And if one is not "sure" about either, from a certain statistical perspective, is it unresonable to say that, all else equal, culling the lower APM guys is likely to be a good idea?
I'll quote your post immediately prior to this one:
schtevie wrote:
I cannot be sure that pooling APMs will lead to an increasing their expected win margin unless I were to be absolutely sure that those leaving are worse than those staying.
Back to top
View user's profile Send private message Send e-mail AIM Address
schtevie
Joined: 18 Apr 2005
Posts: 409
PostPosted: Fri Aug 15, 2008 2:45 pm Post subject: Reply with quote
Goodness Gabe, I think I understand what your point is, but is it interesting?
Never mind that the track record for the constituent players bolsters the estimate, it may or may not be the case that the prorated 7.15 net points per game of the "positive constributors" is greater than the actual 4.7 in the sense that it lies beyond a 95% confidence interval.
Suppose it merely lies beyond a 90% confidence interval, or 72.653%. The point is that the difference is very big in a competitive sense. And in a Bayesian sense, if you are a GM, you would be ill-advised to ignore it.
Back to top
View user's profile Send private message
gabefarkas
Joined: 31 Dec 2004
Posts: 1313
Location: Durham, NC
PostPosted: Sat Aug 16, 2008 9:07 am Post subject: Reply with quote
schtevie wrote:
Goodness Gabe, I think I understand what your point is, but is it interesting?
Never mind that the track record for the constituent players bolsters the estimate, it may or may not be the case that the prorated 7.15 net points per game of the "positive constributors" is greater than the actual 4.7 in the sense that it lies beyond a 95% confidence interval.
Suppose it merely lies beyond a 90% confidence interval, or 72.653%. The point is that the difference is very big in a competitive sense. And in a Bayesian sense, if you are a GM, you would be ill-advised to ignore it.
Well, it seemed interesting enough to you to initially mention it to me, didn't it? I'm just pursuing the line of reasoning that you initiated.
Furthermore, what's with all this "if you were a GM" crap? You've been saying that a lot recently. Is there a job opening you're pursuing?
Back to top
View user's profile Send private message Send e-mail AIM Address
schtevie
Joined: 18 Apr 2005
Posts: 409
PostPosted: Sun Aug 17, 2008 7:46 pm Post subject: Reply with quote
Gabe, I'm not sure why there is a bee in your bonnet. If the rhetorical device of framing a discussion of the optimality of team rosters in terms of the perspective of the responsible party for such matters disturbs you, please ignore this. I thought it effective, but it is certainly not worth getting upset about.
This issue aside, be sure that I do not think your objection (based on classical hypothesis testing) to my calculations is a propos, in the sense of being empirically relevant. And your intuition on the likelihood that my estimates are close to the mark seems to differ from mine.
On this latter point, perhaps there is a way that our intuitions might converge (independent of the availability of actual standard errors for the calculation in question).
What I in fact did was cull out the weakest 30% (measured by APM) of Houston's player minutes and prorate the strongest 70%, which implied an improvement of 2.45 net points per game (on a basis of 4.7). This was viewed by you as a highly uncertain potential outcome.
What if this calculation were repeated for the other 29 teams in the league? Should this inform one's view of what one should typically expect of getting rid of the bottom thirty? Now, I haven't done the math, but sorting and eyeballing some of the teamwise data from www.basketballvalue.com, it appears that the bottom thirty is a common drag on team performance.
Maybe I am not thinking about this the right way, but a net 2.45 improvement doesn't seem like an outlier.
Joined: 18 Apr 2005
Posts: 407
PostPosted: Fri Aug 01, 2008 10:40 am Post subject: Who ya gonna believe... Reply with quote
I am a bit surprised that no one here has chosen the Artest trade as a topic of conversation. Let me do so, as the apparent uber-advocate of Adj.+/-, because I think it may lead to some interesting results, at variance with what appears to be the conventional wisdom.
Ron Artest in Adj.+/- world is an elite player, a true superstar, a HOFer. Taking an unweighted average of such publicly available measures, he sits at #12. This status is much higher than the general appraisal of his worth by the public and media. And by this measure, Houston fleeced Sacramento.
May I propose that we do a round of predictions of how Houston will perform next year? Could someone who is better informed suggest a likely distribution of minutes, given how its roster is currently comprised?
As a first take, from my perspective, the gains to Houston from this trade should be significant, likely enough to make Houston the favorite coming out of the West. This arises both from the essentially certain (one of the reasons for Artest's greatness being his consistency...when playing that is) and significant positive Adj+/- on Artest's account, and the elimination of some of the negative contribution of Jackson. Possibly moderating the former gain is that Artest's minutes will likely be taken away from Scola and Landry, who on one year's data were net positive contributors.
Finally, let me quibble with the lede of Hollinger's recent opining on the subject. What Adj.+/- suggests is that the gain to the Rockets will come from what is Artest's strength: defense. He is a poor man's (?) Kevin Garnett, where the whole of his positive contribution last year is attributed to the defensive end. Yes, both put a bunch of points on the board, but the apparent offensive contribution was but an illusion (if the estimates happened to be precise). And why should things be different next season? Just because the Rockets were already good defensively, is no reason they cannot be better. What you have seen is likely what you will get. (With the minor, intriguing caveat that Artest's boffo Adj.+/- year - plausibly attributable to better offensive performance - was his happy year with Rick Adelman.)
Contrariwise, the better (Adj.+/-) frame for considering the upcoming season is whether McGrady and Ming can step up and regain their form, one which Artest has never lost.
Back to top
View user's profile Send private message
Harold Almonte
Joined: 04 Aug 2006
Posts: 616
PostPosted: Fri Aug 01, 2008 11:26 am Post subject: Reply with quote
I think Artest was taken in order to reinforce the perimeter defense to increase protection of Yao who comes from an injury of consideration. The scoring help is an extra bonus Battier doesn't give, because HOU was in a scoring state of emergency last year, even with the TMac reborn. To say that Artest was a more effective scorer than three of HOU starters, includding one of its first scoring option...
Back to top
View user's profile Send private message
Ilardi
Joined: 15 May 2008
Posts: 262
Location: Lawrence, KS
PostPosted: Fri Aug 01, 2008 11:42 am Post subject: Reply with quote
Yes, Artest has been an elite player from an adj. +/- standpoint for several seasons now. He's only 28, so one wouldn't typically expect any age-related performance dropoff.
Add him to a Houston team that had a +4.7 ppg differential last year, and the Rockets should achieve at least a +8.0 differential for 08-09: good for 60+ wins and the #1 seed in the West.
Back to top
View user's profile Send private message
Kevin Pelton
Site Admin
Joined: 30 Dec 2004
Posts: 976
Location: Seattle
PostPosted: Fri Aug 01, 2008 11:42 am Post subject: Re: Who ya gonna believe... Reply with quote
schtevie wrote:
What Adj.+/- suggests is that the gain to the Rockets will come from what is Artest's strength: defense. He is a poor man's (?) Kevin Garnett, where the whole of his positive contribution last year is attributed to the defensive end.
Eli's version of offensive and defensive adjusted plus-minus suggests this, but it's worth noting that Artest doesn't appear in Dan's defensive top 10 despite overall strong adjusted net plus-minus numbers. So I would say the offensive/defensive balance is not entirely clear.
Also, and this is more of a quibble, a player with an offensive adjusted plus-minus of 0 still makes contributions on offense to the extent that value is best compared to replacement level, not average.
Quote:
(With the minor, intriguing caveat that Artest's boffo Adj.+/- year - plausibly attributable to better offensive performance - was his happy year with Rick Adelman.)
And that it's gone down significantly each of the last two seasons, which may not mean anything but counters the highly positive tone of your post.
The bigger issue remains fit. We have plenty of data on Artest's play on small forward, but power forward is a different issue.
Back to top
View user's profile Send private message Send e-mail Visit poster's website
deepak
Joined: 26 Apr 2006
Posts: 664
PostPosted: Fri Aug 01, 2008 11:47 am Post subject: Reply with quote
I'm not going to venture into win predictions, because I'm not stats-savvy enough to try it.
But I'm familiar enough with the team to where I can take a stab at the minutes distribution. The inclusion of Artest seems to crowd things a lot. I frankly don't see how he, Battier, and the Rockets PFs will get the minutes they should otherwise deserve. Below represents my subjective expected minutes played for each player, per position, assuming all players are available (including a resigned Mutombo and Landry who are right now question marks).
Code:
pos player min
-------------------------
1 Alston 33
1 Brooks 12
1 Barry 3
-------------------------
2 McGrady 30
2 Barry 15
2 Head 3
-------------------------
3 Artest 20
3 Battier 25
3 McGrady 3
-------------------------
4 Scola 15
4 Landry 20
4 Artest 10
4 Hayes 3
-------------------------
5 Yao 34
5 Scola 10
5 Mutombo 4
-------------------------
Back to top
View user's profile Send private message
Ben F.
Joined: 07 Mar 2005
Posts: 391
PostPosted: Fri Aug 01, 2008 12:11 pm Post subject: Reply with quote
Something else to consider if Artest is indeed going to spend most of his time at PF: his rebounding. According to my numbers last year his defensive rebounding percentage was right around 10%, whether he was at PF or SF. The difference between that and what Landry/Scola/Hayes did last year is about 6-7%. If we assume that changes in player defensive rebounding make about 1/3rd of the impact on the team level (as various investigations on diminishing returns suggest) that's a difference in team DR% of about 2.5%. That seems small until you realize it's the difference between #7 in the league (where Houston was last year) and #22 in defensive rebounding.
Now, Artest probably isn't going to play all of his minutes at PF, and it could easily be that the gains on the offensive end from the spacing that Artest at PF brings more than cancel out the worse defensive rebounding. But it still is something to watch for.
Back to top
View user's profile Send private message
Ryan J. Parker
Joined: 23 Mar 2007
Posts: 708
Location: Raleigh, NC
PostPosted: Fri Aug 01, 2008 1:04 pm Post subject: Reply with quote
Quote:
whether he was at PF or SF
I don't want to hijack this thread, but has anyone come up with a good way of identifying where a player fits into a given lineup? Dougstats has positions, but what do we do for the unit that he has the largest number of possessions with?
From basketball value:
Quote:
Artest, Ron - Martin, Kevin - Miller, Brad - Moore, Mikki - Udrih, Beno
This unit took part in 756 offensive and 762 defensive possessions. The categorization from dougstats.com is as follows:
Quote:
Artest=SF, Martin=SG, Miller=C, Moore=C, Udrih=PG
So back to my original question: who is PF in this lineup? Can we do better than saying that Pr(Miller is PF) = 0.5 and Pr(Moore is PF) = 0.5?
I haven't really tried to investigate this too much yet, but it seems the best time to ask given the discussion.
Back to top
View user's profile Send private message Visit poster's website
Ben F.
Joined: 07 Mar 2005
Posts: 391
PostPosted: Fri Aug 01, 2008 2:14 pm Post subject: Reply with quote
Ryan J. Parker wrote:
I don't want to hijack this thread, but has anyone come up with a good way of identifying where a player fits into a given lineup?
I had posted about the method I used in a previous thread, here is my description:
Quote:
I decided to go through the list of every NBA player who played last year and assign a role among the following 6 categories: PG, combo guard, wing, forward, post, C. In my mind those are really the 6 main player types in the NBA: a point guard, someone who is short enough to play PG but is really still a scorer so that when paired with another bigger PG he'd still be an SG (think Allen Iverson), a wing player (someone who can slide between SG/SF), a forward (someone who's an SF/PF, a la Shawn Marion), a post player (basically a PF/C), and a center (someone who is the center regardless of height - think Kendrick Perkins as the C even when KG is on the court). You can then sort any lineup positionally by ordering them according to those positions, with height/weight being the tiebreaker. So if a team had 3 "PG"s on the court, the assigned PG would be the smallest player, the assigned SG the second smallest, etc.
Obviously it's still decently subjective, but because it uses actual lineups I think it does a better job than most methods. You can see the results for this past year here. There may well be mistakes in classification, but I think it's pretty accurate for the overwhelming number of players.
Ryan J. Parker wrote:
From basketball value:
Quote:
Artest, Ron - Martin, Kevin - Miller, Brad - Moore, Mikki - Udrih, Beno
This unit took part in 756 offensive and 762 defensive possessions. The categorization from dougstats.com is as follows:
Quote:
Artest=SF, Martin=SG, Miller=C, Moore=C, Udrih=PG
So back to my original question: who is PF in this lineup? Can we do better than saying that Pr(Miller is PF) = 0.5 and Pr(Moore is PF) = 0.5?
Since both are listed at 7-0 according to NBA.com (and both at 6-11 according to B-R.com) but Brad Miller weighs about 40 pounds more my method would classify him as the center.
Still, that doesn't really effect the analysis of Artest, who it looks like would flip between SF when the Moore/Miller combo was on the floor and PF when it was not.
Back to top
View user's profile Send private message
Ryan J. Parker
Joined: 23 Mar 2007
Posts: 708
Location: Raleigh, NC
PostPosted: Fri Aug 01, 2008 2:30 pm Post subject: Reply with quote
Ben, that is just what I was looking for. Clearly error is involved regardless, but that method looks like it would reduce it the most. I think this will give me just what I'm looking for when used in combination with dougstats. If a "well defined" lineup isn't in place according to dougstats, then this can be used to try to classify missing and/or overlapping positions.
Back to top
View user's profile Send private message Visit poster's website
Mountain
Joined: 13 Mar 2007
Posts: 1527
PostPosted: Fri Aug 01, 2008 8:58 pm Post subject: Reply with quote
I mentioned the issue of Artest's raw +/- splits at PF and SF in another thread. I didn't feel like taking the lead in making it a new topic at the time but it is good there is interest in doing so.
Deepak's minutes projection might be close to what happens though PF is crowded and could change and PG should change in my opinion.
McGrady / Battier together works well for the Rockets especially on +/- (though less so last season compared to 06-07) and we'll probably see a lot more of that. They win a bit less together than apart on raw +/-, though the level of opponents faced probably varies in these splits with together likely facing more starters. Maybe there are some types of opponent match-ups where it is less good and a better option might now be available.
I wonder if we will see a lot of Barry / Artest together as their replacements. That would be positive on adjusted +/- for Barry paired with positive on defense for Artest.
Would McGrady / Artest and Barry / Battier work better? Try all the combos and see how they work with different bigs and different PGs. Lots of match-up capability and Adelman should do well with the resources.
Last edited by Mountain on Sat Aug 02, 2008 10:12 am; edited 1 time in total
Back to top
View user's profile Send private message
schtevie
Joined: 18 Apr 2005
Posts: 407
PostPosted: Sat Aug 02, 2008 8:22 am Post subject: Reply with quote
Kevin, allow me to quibble with your quibbles.
First, I did consult but not note Dan's originally provided Defensive Adj.+/- data, only because the relevant data was missing. His article shows top and bottom ten players by position, sorted by Overall +/-, not Adj. +/-. Now, it may be that Artest is not in the latter top ten, but if you look at the missing Adj.+/- percentiles in the list provided, he may well be (and these are the years when he was considered 1st Team NBA on Defense, I think.)
Next quibble, why would one want to compare offensive (or defensive or overall) Adj.+/- contributions to replacement level players? Conceptually, it makes no sense, as the benchmark should be whether a player contributes to winning or losing, i.e. a +/- of 0. And second, the benchmark you suggest bounces around from year to year and depends on the definition of a replacement level player. What is the utility in that?
Third quibble, a semi-quibble. You are correct in noting that Artest's productivity has decreased the past three years. Dropping from his all-time high of 11.83 to his lowest ever posting of about 5. It is not clear whether this is noise, given that he is still in his demographic prime, or a trend. We shall see. (Not that 5 is bad, of course. To the contrary, if real, it is very good, and should give Houston the aforementioned bump.) However, you neglect to note that the same "trend" exists with McGrady and Ming, and this is even more pronounced. Again, the Adj.+/- frame to the Houston story has nothing to do with how "ghetto" Artest is and everything to do with whether McGrady and Ming can return to form. Artest is a huge asset, period (well, barring freak-outs.)
As for your final comment on the importance of fit, that is a very interesting issue. It would be cool to know how Adj.+/- is influenced by player position, and maybe such a project can go in Steve's in box.
Back to top
View user's profile Send private message
Mountain
Joined: 13 Mar 2007
Posts: 1527
PostPosted: Sat Aug 02, 2008 10:47 am Post subject: Reply with quote
Over past 2 seasons Artest was best - on raw +/- with scoring big Brad Miller (and in 06-07 with C Willliamson) and worst with perimeter scorer Salmons (and in 06-07 also low with K Martin). But that was consistent with the overall average team results of playing with those players so it might not be indicative on any general type compatability trend for Artest. Still looking back further Artest was above his average when playing with the leading bigs in Sacramento in 05-06 and Indiana in 03-04.
Last season no Artest as PF lineup - used over 50 minutes was better than +1 on raw +/-. His best lineups were when paired with 2 7 footers in Miller/Moore.
Maybe Artest will do well with Yao or Scola and perhaps especially when that trio is on court together? And maybe pairing with McGrady will be lukewarm ... or less? We'll see if these reaches for clues bear out.
Deepak's minute projection has McGrady / Yao going for 64 minutes per regular season game instead of the 74 combined last season (though not always together). Artest's arrival would make this more feasible and I'd support that and not get swept up in trying for 60+ wins and possibly wearing those 2 out in pursuit of highest playoff seed- especially given their injury history and playoff history. I'd think taking a Spurs like approach and playing your top 2 64 minutes or not much more in the regular season would help some come playoffs.
Back to top
View user's profile Send private message
NickS
Joined: 30 Dec 2004
Posts: 384
PostPosted: Sat Aug 02, 2008 12:20 pm Post subject: Reply with quote
Ilardi wrote:
Add him to a Houston team that had a +4.7 ppg differential last year, and the Rockets should achieve at least a +8.0 differential for 08-09: good for 60+ wins and the #1 seed in the West.
I just want to say that I am a skeptic. I am willing to agree that, if the rockets have a point differential above +6 that I will surprised, and that I would count that as a successful prediction for adjusted +/-.
In this case I don't have a model that I'm looking at, just me general sense of following the league doesn't make me think that the Rockets will be title contenders this season. Call it naive conventional wisdom, but it would be really interesting to me if the quoted prediction comes true.
Back to top
View user's profile Send private message
deepak
Joined: 26 Apr 2006
Posts: 664
PostPosted: Sat Aug 02, 2008 5:46 pm Post subject: Reply with quote
NickS wrote:
In this case I don't have a model that I'm looking at, just me general sense of following the league doesn't make me think that the Rockets will be title contenders this season. Call it naive conventional wisdom, but it would be really interesting to me if the quoted prediction comes true.
Other than health, what do you think the Rockets are missing that keeps them from being contenders? They've shown the last two seasons they can win 50+ games in the regular season with key players missing a large chunk of the season.
Back to top
View user's profile Send private message
cherokee_ACB
Joined: 22 Mar 2006
Posts: 157
PostPosted: Sat Aug 02, 2008 6:03 pm Post subject: Re: Who ya gonna believe... Reply with quote
Kevin Pelton wrote:
... but it's worth noting that Artest doesn't appear in Dan's defensive top 10 despite overall strong adjusted net plus-minus numbers.
You are talking different seasons there. As Dan said here
http://danrosenbaum.blogspot.com/2005/0 ... usted.html
"Remember that Ron Artest did not make this list because he did not play 1,000 minutes last season"
Anyway, his raw on-off data those two seasons point to a bigger impact on defense
http://www.82games.com/03IND7D.HTM
http://www.82games.com/04IND9D.HTM
page 2 missing
page 3
schtevie
Joined: 18 Apr 2005
Posts: 408
PostPosted: Wed Aug 06, 2008 7:48 am Post subject: Reply with quote
Gabe, are you saying that there is no correlation between the APM estimates for teammates?
Back to top
View user's profile Send private message
Ryan J. Parker
Joined: 23 Mar 2007
Posts: 708
Location: Raleigh, NC
PostPosted: Wed Aug 06, 2008 9:42 am Post subject: Reply with quote
Quote:
Call me daft, but I honestly have no idea what this means. How do the words "marginal utility" go with "general topic" and "distinctly positive"?
You're doing better than me. I can't interpret half of what schtevie says. Sad Big words are the death of me!
Back to top
View user's profile Send private message Visit poster's website
gabefarkas
Joined: 31 Dec 2004
Posts: 1313
Location: Durham, NC
PostPosted: Wed Aug 06, 2008 10:24 am Post subject: Reply with quote
schtevie wrote:
Gabe, are you saying that there is no correlation between the APM estimates for teammates?
I don't know what the correlation is, or even if it is negative or positive. Do you?
Back to top
View user's profile Send private message Send e-mail AIM Address
schtevie
Joined: 18 Apr 2005
Posts: 408
PostPosted: Wed Aug 06, 2008 10:55 am Post subject: Reply with quote
Maybe I am thinking about this the wrong way, but my expectation is that the covariance of teammates' APMs would be negative.
And on the other issue, sorry to be obtuse. My point is I enjoy and think there is value in any and all discussions of APM.
Back to top
View user's profile Send private message
Kevin Pelton
Site Admin
Joined: 30 Dec 2004
Posts: 978
Location: Seattle
PostPosted: Wed Aug 06, 2008 10:57 am Post subject: Reply with quote
The adjusted plus-minus for a team in a given season should more or less sum to its point differential, right? In that case, to the extent that adjusted plus-minus for one player is "off," it would be offset in the other direction by other players, right?
I don't think that would make teammates' ratings correlated, but it would indicate that if a team is kept together, our assessment of their overall adjusted plus-minus is more precise.
Does that make sense?
Back to top
View user's profile Send private message Send e-mail Visit poster's website
DLew
Joined: 13 Nov 2006
Posts: 224
PostPosted: Wed Aug 06, 2008 11:56 am Post subject: Reply with quote
Yeah, Kevin and Schtevie are correct. Because adjusted plus-minus fits to team point differential then as the play-minutes in question become a greater percentage of the team minutes the error will decrease. For instance if we considered all of the rockets players except for one low minute guy then that total would be very close to team point differential and we would know the error on that estimate to be low.
Back to top
View user's profile Send private message
gabefarkas
Joined: 31 Dec 2004
Posts: 1313
Location: Durham, NC
PostPosted: Wed Aug 06, 2008 8:07 pm Post subject: Reply with quote
schtevie wrote:
Maybe I am thinking about this the wrong way, but my expectation is that the covariance of teammates' APMs would be negative.
Why? Why couldn't it take the range of all possible values? If two players are on the court together a lot, it seems to me their APMs are going to be fairly strongly dependent on each other, no?
Also, for two players who are now going to be teammates (such as Artest and Rocket Player X), how can you make any statement whatsoever about the potential relationship between their APM? I'm not saying you can't, I'm just asking on what basis you can do so.
Back to top
View user's profile Send private message Send e-mail AIM Address
schtevie
Joined: 18 Apr 2005
Posts: 408
PostPosted: Wed Aug 06, 2008 10:07 pm Post subject: Reply with quote
I wasn't trying to make any statement at all about the expected relationship of APMs between future teammates (such as Artest and Rocket Player X) only current ones. And I am not denying the possibility that the covariance between teammates can take a range of possible values.
But my expectation for any player pair is that the covariance is negative. APM represents apportioned credit for individual line-up +/-s. McGrady and Ming shared the court for half of Ming's minutes and about forty percent of McGrady's. If McGrady's estimate is lower than his true APM, there is a good chance that Ming's is erroneously high, hence my point that there is a good chance that they were collectively mediocre.
Back to top
View user's profile Send private message
gabefarkas
Joined: 31 Dec 2004
Posts: 1313
Location: Durham, NC
PostPosted: Thu Aug 07, 2008 6:05 am Post subject: Reply with quote
schtevie wrote:
Running the Adj.+/- numbers, you see that by merely prorating the minutes of the Rockets players remaining from last year's roster, the team would improve from 4.7 per game to 6+.
This is what you wrote a few days ago (on the previous page). At least to me, this seems to imply that the APMs of their remaining players will likely cause their expected win margin to increase. Is that a correct interpretation?
schtevie wrote:
But my expectation for any player pair is that the covariance is negative. APM represents apportioned credit for individual line-up +/-s. McGrady and Ming shared the court for half of Ming's minutes and about forty percent of McGrady's. If McGrady's estimate is lower than his true APM, there is a good chance that Ming's is erroneously high, hence my point that there is a good chance that they were collectively mediocre.
If the expectation of the covariance for any player pair is negative, meaning one is higher than it "should be" while the other is lower than it "should be", how can you be sure that pooling their APMs will lead to an increase in their expected win margin? More specifically, if one player will likely have a lower APM (in your example, Ming), while the other will likely have a higher APM (in your example, McGrady), how does this lead to the above conclusion regarding their expected win margin?
Back to top
View user's profile Send private message Send e-mail AIM Address
gabefarkas
Joined: 31 Dec 2004
Posts: 1313
Location: Durham, NC
PostPosted: Thu Aug 07, 2008 6:06 am Post subject: Reply with quote
DLew wrote:
Yeah, Kevin and Schtevie are correct. Because adjusted plus-minus fits to team point differential then as the play-minutes in question become a greater percentage of the team minutes the error will decrease. For instance if we considered all of the rockets players except for one low minute guy then that total would be very close to team point differential and we would know the error on that estimate to be low.
So then if a team fielded only 5 players all year, and all 5 played 100% of their minutes together, the error would be 0? Is that what you're implying?
Back to top
View user's profile Send private message Send e-mail AIM Address
schtevie
Joined: 18 Apr 2005
Posts: 408
PostPosted: Thu Aug 07, 2008 9:44 am Post subject: Reply with quote
Gabe, I think you are correctly interpreting my remarks about my baseline calculation for the Rockets in '09. This "addition by subtraction" assumes that the remaining players, who had higher APMs, will maintain this productivity in having their '08 per game minutes reduced but number of games played increased. To the extent that the older players will deteriorate, to the extent that the '08 estimates are imprecise, and to the extent that my assumptions violate NBA 101 in terms of Xs and Os, my estimate is misconceived. Otherwise, I am quite happy with it.
As for your second point, I don't quite understand your concern that notional negative covariances between players undermines the pooled APM estimate, a priori. If it so happens that the players culled from the Rockets roster happened to have APMs lower than their "true" value relative to those that remained, then the pooled estimate of the remaining roster will be to too high. Coversely, if the dumped players are even worse than their estimated APMs, the remaining roster should be expected to be better still. I cannot be sure that pooling APMs will lead to an increasing their expected win margin unless I were to be absolutely sure that those leaving are worse than those staying.
Back to top
View user's profile Send private message
NickS
Joined: 30 Dec 2004
Posts: 384
PostPosted: Thu Aug 07, 2008 10:05 am Post subject: Reply with quote
gabefarkas wrote:
DLew wrote:
Yeah, Kevin and Schtevie are correct. Because adjusted plus-minus fits to team point differential then as the play-minutes in question become a greater percentage of the team minutes the error will decrease. For instance if we considered all of the rockets players except for one low minute guy then that total would be very close to team point differential and we would know the error on that estimate to be low.
So then if a team fielded only 5 players all year, and all 5 played 100% of their minutes together, the error would be 0? Is that what you're implying?
The error for the five of them, taken as a 5-man unit would be zero. The error for each individual player would be impossible to estimate.
I take him as saying that if, in this example, you combined the minutes of T-Mac and Yao into one player, and called that player T-Ming. The error for T-Ming would be lower than the error for either T-Mac or Yao separately, because it's accounting for a greater portion of the total minutes.
Back to top
View user's profile Send private message
DLew
Joined: 13 Nov 2006
Posts: 224
PostPosted: Thu Aug 07, 2008 11:20 am Post subject: Reply with quote
Exactly correct on the first point. If a team had only five players the errors on the individual players would basically be infinite, as we would be unable to determine their coefficients, but the error for those five players together would be zero. This result is never achieved in the NBA, but in evaluating some groups of players within a team it is approached.
In the T-Ming case the coefficient won't necessarily be closer to the true value, but it is very likely that it will be.
Back to top
View user's profile Send private message
Mountain
Joined: 13 Mar 2007
Posts: 1527
PostPosted: Thu Aug 07, 2008 6:34 pm Post subject: Reply with quote
There was a huge swing between 2005-6 and last season for the combined adjusted +/- of TMac-Yao, namely from +21.5 to -0.3. Would the combined estimated error be maybe + or - 6 for each season? That still leaves a long distance (at least 9 pts, a huge per game amount really) to try to understand.
Did they pair really change that much in impact? Did the rotation or role under new coach / system change so much that credit assignment properly shifts substantially away from them to others? (That may not matter if you already know you're sticking with them but it does if you were open to change.) The quality of rest of squad certainly changed a lot but did it really change that much?
Team differential only changed a total of a bit over 6 points. So assuming the perfect storm of TMac-Yao overestimate in 2005-6 and underestimate in 2007-8 the pair might have only gone from +15 to +6 and given the team point differentials the rest of squad might have went from about -16 to -1 to produce a total team +/- transition from -1.6 to +4.7?
It that the best guess of what happened? How confident are people of that? I am not convinced that is what happened but want to consider it fairly. Maybe this an even more extreme circumstance than I outlined.
I saw that in 05-06 TMac and Yao were on the floor together less than half the time and thought that might be part of it but they were only on floor together just under half their minutes this past season too so that much is similar. In 04-05 and 06-07 the % of time together was significantly higher. Maybe those years being together more made the combined +/- estimate more accurate at least for the combo but less certain for the 2 individually? The combined totas were +7 and +8. You could look at the 4 years and average or look at them and throw out 2005-06. Those are probably decent ways to draw a conclusion and move on. The "true" story might be close to that or different.
You could keep looking for more explanation. Maybe in 05-06 when one was out the other picked up much of that stat responsibility and delivered the goods as the rest of cast was less capable of doing so while this past season the rest of cast could and did? Maybe the superstars regressed some too. From age, injury, effort or the league figuring out how to combat particularly the duo. More one without the other in 05-06 and 07-08 might have created a broader distribution of lineups and affected the opportunity for "finding" the value of the second superstar vs the rest of squad. The roster turnover makes it harder to resolve. Tough to say with much confidence at least for me at this point.
Back to top
View user's profile Send private message
gabefarkas
Joined: 31 Dec 2004
Posts: 1313
Location: Durham, NC
PostPosted: Thu Aug 07, 2008 8:43 pm Post subject: Reply with quote
schtevie wrote:
As for your second point, I don't quite understand your concern that notional negative covariances between players undermines the pooled APM estimate, a priori. If it so happens that the players culled from the Rockets roster happened to have APMs lower than their "true" value relative to those that remained, then the pooled estimate of the remaining roster will be to too high. Coversely, if the dumped players are even worse than their estimated APMs, the remaining roster should be expected to be better still. I cannot be sure that pooling APMs will lead to an increasing their expected win margin unless I were to be absolutely sure that those leaving are worse than those staying.
That's my point. We have no way of being sure. Not even close to it.
page 4
schtevie
Joined: 18 Apr 2005
Posts: 409
PostPosted: Fri Aug 08, 2008 1:03 pm Post subject: Reply with quote
Gabe, here are the actual numbers. Prorating minutes per game on the '08 Rockets roster (taking actual MPG, converting these to a possession basis, then applying estimated individual APM statistics) where one group is the positive APM players (except for Yao Ming and Aaron Brooks) and the other group is the negative APM players (except for Kirk Snyder - and one assumes that the players with insufficient minutes get a replacement level value of -2, which makes the team net point differential equal the actual) we get the following:
(1) The "positive" team has an APM of 7.91 and a net point per game equivalent of 7.15.
(2) The "negative" team has an APM of -10.04 and a net point per game equivalent of -9.08.
This compares to an actual APM of 5.2 and net point per game of 4.7.
Setting aside any Xs and Os objection. What exactly are you saying that we cannot be sure about? That 7.15 is not bigger than 4.7? That 7.15 is not bigger than -9.08? And if one is not "sure" about either, from a certain statistical perspective, is it unresonable to say that, all else equal, culling the lower APM guys is likely to be a good idea?
Back to top
View user's profile Send private message
Ilardi
Joined: 15 May 2008
Posts: 263
Location: Lawrence, KS
PostPosted: Fri Aug 08, 2008 1:23 pm Post subject: Reply with quote
schtevie wrote:
Gabe, here are the actual numbers. Prorating minutes per game on the '08 Rockets roster (taking actual MPG, converting these to a possession basis, then applying estimated individual APM statistics) where one group is the positive APM players (except for Yao Ming and Aaron Brooks) and the other group is the negative APM players (except for Kirk Snyder - and one assumes that the players with insufficient minutes get a replacement level value of -2, which makes the team net point differential equal the actual) we get the following:
(1) The "positive" team has an APM of 7.91 and a net point per game equivalent of 7.15.
(2) The "negative" team has an APM of -10.04 and a net point per game equivalent of -9.08.
This compares to an actual APM of 5.2 and net point per game of 4.7.
Setting aside any Xs and Os objection. What exactly are you saying that we cannot be sure about? That 7.15 is not bigger than 4.7? That 7.15 is not bigger than -9.08? And if one is not "sure" about either, from a certain statistical perspective, is it unresonable to say that, all else equal, culling the lower APM guys is likely to be a good idea?
Schtevie,
I certainly wouldn't want to put words in anyone's mouth, but I think the objection might simply be that there's enough noise in the individual player APM (adj +/-) estimates right now to raise doubt about the degree to which 4.7 truly differs from 7.15 at a reasonable confidence level (i.e., that a 95% confidence interval constructed around your high-APM aggregate would probably still include 4.7 at the low end of the interval). If the APM estimates were low-noise (i.e., low SE), then this objection would disappear; but they're not, and it won't (for now).
Of course, in a Bayesian sense, 7.15 still represents our best a priori guess about what your high-APM aggregate will do - and it's a reasonably good guess, to boot - it's just that it's the sort of guess that will sometimes prove to be off by a fair margin.
Back to top
View user's profile Send private message
schtevie
Joined: 18 Apr 2005
Posts: 409
PostPosted: Fri Aug 08, 2008 2:51 pm Post subject: Reply with quote
Steve, I have no disagreements whatsoever with your observations. 4.7 points might, in fact, be outside a 95% confidence interval (my guess - merely a guess - is that it would be close). From the standpoint of GM decision-making, however, it is a Bayesian world.
Finally, note that this digression does not relate to the, presumably positive, effect of Ron Artest, whose prospective contribution (and the likely relative success of an APM approach as a predictive methodology) was the motive for this string.
Back to top
View user's profile Send private message
Ilardi
Joined: 15 May 2008
Posts: 263
Location: Lawrence, KS
PostPosted: Fri Aug 08, 2008 3:56 pm Post subject: Reply with quote
Yes, Artest has been an elite player, based on his adj +/- ratings, for the past 6 years, so there's little doubt: he'll have a net positive impact on the Rockets next season (assuming that he's reasonably healthy and doesn't go postal).
Back to top
View user's profile Send private message
gabefarkas
Joined: 31 Dec 2004
Posts: 1313
Location: Durham, NC
PostPosted: Fri Aug 15, 2008 1:02 pm Post subject: Reply with quote
schtevie wrote:
(1) The "positive" team has an APM of 7.91 and a net point per game equivalent of 7.15.
(2) The "negative" team has an APM of -10.04 and a net point per game equivalent of -9.08.
This compares to an actual APM of 5.2 and net point per game of 4.7.
Setting aside any Xs and Os objection. What exactly are you saying that we cannot be sure about? That 7.15 is not bigger than 4.7? That 7.15 is not bigger than -9.08? And if one is not "sure" about either, from a certain statistical perspective, is it unresonable to say that, all else equal, culling the lower APM guys is likely to be a good idea?
I'll quote your post immediately prior to this one:
schtevie wrote:
I cannot be sure that pooling APMs will lead to an increasing their expected win margin unless I were to be absolutely sure that those leaving are worse than those staying.
Back to top
View user's profile Send private message Send e-mail AIM Address
schtevie
Joined: 18 Apr 2005
Posts: 409
PostPosted: Fri Aug 15, 2008 2:45 pm Post subject: Reply with quote
Goodness Gabe, I think I understand what your point is, but is it interesting?
Never mind that the track record for the constituent players bolsters the estimate, it may or may not be the case that the prorated 7.15 net points per game of the "positive constributors" is greater than the actual 4.7 in the sense that it lies beyond a 95% confidence interval.
Suppose it merely lies beyond a 90% confidence interval, or 72.653%. The point is that the difference is very big in a competitive sense. And in a Bayesian sense, if you are a GM, you would be ill-advised to ignore it.
Back to top
View user's profile Send private message
gabefarkas
Joined: 31 Dec 2004
Posts: 1313
Location: Durham, NC
PostPosted: Sat Aug 16, 2008 9:07 am Post subject: Reply with quote
schtevie wrote:
Goodness Gabe, I think I understand what your point is, but is it interesting?
Never mind that the track record for the constituent players bolsters the estimate, it may or may not be the case that the prorated 7.15 net points per game of the "positive constributors" is greater than the actual 4.7 in the sense that it lies beyond a 95% confidence interval.
Suppose it merely lies beyond a 90% confidence interval, or 72.653%. The point is that the difference is very big in a competitive sense. And in a Bayesian sense, if you are a GM, you would be ill-advised to ignore it.
Well, it seemed interesting enough to you to initially mention it to me, didn't it? I'm just pursuing the line of reasoning that you initiated.
Furthermore, what's with all this "if you were a GM" crap? You've been saying that a lot recently. Is there a job opening you're pursuing?
Back to top
View user's profile Send private message Send e-mail AIM Address
schtevie
Joined: 18 Apr 2005
Posts: 409
PostPosted: Sun Aug 17, 2008 7:46 pm Post subject: Reply with quote
Gabe, I'm not sure why there is a bee in your bonnet. If the rhetorical device of framing a discussion of the optimality of team rosters in terms of the perspective of the responsible party for such matters disturbs you, please ignore this. I thought it effective, but it is certainly not worth getting upset about.
This issue aside, be sure that I do not think your objection (based on classical hypothesis testing) to my calculations is a propos, in the sense of being empirically relevant. And your intuition on the likelihood that my estimates are close to the mark seems to differ from mine.
On this latter point, perhaps there is a way that our intuitions might converge (independent of the availability of actual standard errors for the calculation in question).
What I in fact did was cull out the weakest 30% (measured by APM) of Houston's player minutes and prorate the strongest 70%, which implied an improvement of 2.45 net points per game (on a basis of 4.7). This was viewed by you as a highly uncertain potential outcome.
What if this calculation were repeated for the other 29 teams in the league? Should this inform one's view of what one should typically expect of getting rid of the bottom thirty? Now, I haven't done the math, but sorting and eyeballing some of the teamwise data from www.basketballvalue.com, it appears that the bottom thirty is a common drag on team performance.
Maybe I am not thinking about this the right way, but a net 2.45 improvement doesn't seem like an outlier.
Re: Recovered old threads- miscellaneous topics
Crow
Joined: 20 Jan 2009
Posts: 795
PostPosted: Sun Nov 22, 2009 7:19 pm Post subject: Investigating the Winston Theorem Reply with quote
http://tomsbombs.blogspot.com/2009/10/d ... nston.html
Winston appears to mean 2 guys who can't hit an outside shot.
Thanks for the data.
Just starting to look at it.
As you say it doesn't offer strong support for the theorem but there would be other possible cuts at it or finding something close to it.
I've had similar questions about the impact on lineups of 2 guys low on usage, low overall TS% or high=percentage shot frequency or accuracy, etc. or maybe a combination and perhaps the match of perimeter and interior matters.
To isolate offense though it would be better to look at offensive efficiency of pairs compared to players without the another player rather than +/- also affected by defense. 82games player pair table allows that, right now for 08-09 but eventually again for this season I assume.
Last edited by Crow on Mon Nov 23, 2009 2:38 pm; edited 2 times in total
Back to top
View user's profile Send private message
habetw4
Joined: 12 Nov 2009
Posts: 22
Location: CT
PostPosted: Sun Nov 22, 2009 7:59 pm Post subject: Reply with quote
"My theory on the lineups that play worse is that they have two guys who can’t hit the broad side of a barn." Do you think he's only talking about offensive efficiency or the team overall? I think it's the latter.
Back to top
View user's profile Send private message Send e-mail Visit poster's website
Crow
Joined: 20 Jan 2009
Posts: 795
PostPosted: Sun Nov 22, 2009 8:01 pm Post subject: Reply with quote
He probably is thinking the weak offense leads to bad overall results but to isolate the effect I'd look at offensive efficiency first.
Back to top
View user's profile Send private message
Crow
Joined: 20 Jan 2009
Posts: 795
PostPosted: Sun Nov 22, 2009 8:16 pm Post subject: Reply with quote
Looking quickly at the 5 lineups that played 300+ minutes and had weak Offensive ratings I see they all have player usage rates than sum to less than 100%. I learned about this lineup trend at the XOHoops simulator.
Of course 5 lineups isn't proof but it is a hint.
These lineups average only 1 guy bad on mid-range FG%- compared to league average- but almost 2 who shot from mid-range at a high frequency. That's "guys who can’t hit the broad side of a barn" based on frequency of choosing a bad shot location.
As I noted in another thread the Offensive Adjusted +/- of the top 20 on mid-range frequency as a % of total shots in the league is 3 negative for every positive.
Winston wondered about Noah and Thomas and their outside shooting, in your other article http://www.hoopdata.com/recent.aspx?aid=45
you raise questions about Chicago's high rate of long 2s- which mainly come from the other 3 guys Rose, Gordon and Deng and the latter may well be more important. I raised the issue about sum total lineup usage. Put all three together and it is a perfect storm and not surprising that Chicago lineup of
Deng- Gordon- Noah- Rose- Thomas
pulled a 101.5 Offensive Rating last season and was allowed to disappear, perhaps more fortuitously than knowingly given that they substituted Salmons for Gordon and it is all the same complaints and pulling a 100 Offensive Rating as the third most used lineup though fortunately being used only about 3 minutes a game.
It is probably worth noting that my criteria Boston's most used lineup qualifies as only having 1 guy with high frequency of mid-range shots- Garnett and they pull a 113 Offensive rating. Substitute Sheed for Perkins and the Offensive rating drops to 103. Maybe when you take as many 3s as he is and his current eFG% it is essentially the same as shooting from mid-range... and harmful. By contrast Boston's second most used lineup has no excessive mid-range shooters and has an Offensive Rating of 127. Just one data point but I noticed that. Though there are some lineups over 100+ minutes in the league with high Offensive ratings with 2 or more frequent mid-range shooters. It probably isn't a hard and fast thing and there are surely other nuances- like the sum of usage that might mitigate (all but one appear to have sum of usage well above 100 ) as might the quality of mid-range shooting or the quality of the shooting from the high percentage zones.
Last edited by Crow on Sun Nov 22, 2009 9:47 pm; edited 10 times in total
Back to top
View user's profile Send private message
Qscience
Joined: 22 Jun 2009
Posts: 67
Location: Phoenix, Arizona
PostPosted: Sun Nov 22, 2009 8:56 pm Post subject: Reply with quote
You know to be honest Wayne really set himself up when he said those remarks about KDurant. If you do not study the game itself your stats are absolutely worthless to a professional. Those stats become an amatuerish view of the game and to be honest more self serving than truth.
Hopefully Wayne stops trying to make news with theories that are not tested and true because it really hurts quote this stat field in general.
Back to top
View user's profile Send private message Visit poster's website
deepak
Joined: 26 Apr 2006
Posts: 664
PostPosted: Sun Nov 22, 2009 10:22 pm Post subject: Reply with quote
I assumed he was referring to range shooting, not so much eFG%.
How many lineups that use two front-court players that don't shoot a lot from outside, say, 18 feet, are really effective on offense?
Back to top
View user's profile Send private message
Crow
Joined: 20 Jan 2009
Posts: 795
PostPosted: Sun Nov 22, 2009 11:12 pm Post subject: Reply with quote
Among heavily used and strong offensive lineups Horford-Smith might be about as low on non-inside shooting from the bigs as any other.
Among other strong offensive lineups low on non-inside shooting from the bigs I see Thomas-Collison and Shaq-Hickson.
Back to top
View user's profile Send private message
Mike G
Joined: 14 Jan 2005
Posts: 3535
Location: Hendersonville, NC
PostPosted: Tue Jan 05, 2010 6:13 pm Post subject: Reply with quote
Today on TrueHoop, I read:
Quote:
It's generally agreed that plus/minus stats need large numbers of games to be meaningful. Now that we have ten weeks of the NBA season under our belts, it's time to see what Winston's spreadsheets are saying about the season so far:
1. Who are the key Celtics this season?
Kevin Garnett is not the KG of the past. His adjusted plus/minus is minus-6 and his offense rating is minus 10.
This doesn't sound very familiar, so I look at
http://basketballvalue.com/teamplayers. ... 0&team=BOS
.. and I see Garnett at +5.91 for his 857 minutes this year.
His Offense is +1.29
How can various 'adjusted plus/minus' be that different?
_________________
`
36% of all statistics are wrong
Back to top
View user's profile Send private message Send e-mail
Ryan J. Parker
Joined: 23 Mar 2007
Posts: 708
Location: Raleigh, NC
PostPosted: Tue Jan 05, 2010 6:17 pm Post subject: Reply with quote
Wayne uses per 48 minutes. Pretty sure Aaron is using per 100 possessions.
_________________
I am a basketball geek.
Back to top
View user's profile Send private message Visit poster's website
deepak
Joined: 26 Apr 2006
Posts: 664
PostPosted: Tue Jan 05, 2010 6:22 pm Post subject: Reply with quote
Mike G wrote:
Today on TrueHoop, I read:
Quote:
It's generally agreed that plus/minus stats need large numbers of games to be meaningful. Now that we have ten weeks of the NBA season under our belts, it's time to see what Winston's spreadsheets are saying about the season so far:
1. Who are the key Celtics this season?
Kevin Garnett is not the KG of the past. His adjusted plus/minus is minus-6 and his offense rating is minus 10.
This doesn't sound very familiar, so I look at
http://basketballvalue.com/teamplayers. ... 0&team=BOS
.. and I see Garnett at +5.91 for his 857 minutes this year.
His Offense is +1.29
How can various 'adjusted plus/minus' be that different?
Not sure what the explanation for the discrepency in APM is. But the Off Rtg on basketballvalue is not adjusted (just On-court minus Off-court).
For the APM ratings to disagree by nearly 12 points seems very strange. Basketballvalue does show Garnett's Std Err to be the highest on the team, and 8th highest in the league.
Back to top
View user's profile Send private message
jsill
Joined: 19 Aug 2009
Posts: 73
PostPosted: Tue Jan 05, 2010 8:46 pm Post subject: Reply with quote
The discrepancy between Winston's results and basketballvalues's seems to be mostly a result of 2 things: weighting the game segments by clock time elapsed (as Ryan mentioned) and not using a general "reference player" to represent players who have not played many minutes. I am not sure of the minutes cutoff Aaron Barzilai is using at basketballvalue, but from eyeballing it, it looks like it's around 300 minutes. Winston mentioned at that NESSIS conference that he doesn't use the reference player approach.
By the way, the thing I learned from that TrueHoop piece which made me happiest is that Aaron is working for the Grizzlies. Well, maybe that's old news to some of you, but not to me. Congrats to Aaron!
I have implemented APM using a weighting by clock time elapsed (as well as the more commonly used possessions-weighting). I have run experiments based on this season alone, although they're not up on my site yet. If I don't use regularization and if I don't use a reference player but I do use time-weighting, I get Garnett at -7.6, a similar result to Winston's. This puts Garnett at 297th out of 419 players. If I continue to use time weighting but I use a minutes cutoff of 300 minutes, I get Garnett at -2.04, or 155th out of 291 players. If I use possessions weighting and a cutoff of 300 minutes, I get Garnett at + 6.6 (62nd place out of 291).
Well, these are the kinds of results you tend to get (i.e. parameter estimates which are rather unstable and overly sensitive to seemingly minor implementation choices) if you don't use regularization. You're going to overfit like crazy on less than half of one season.
If I do use an appropriately chosen regularization parameter, chosen via cross-validation, then these are the results I get for Garnett:
Time weighted, no minutes cutoff:
+1.48 (35th best in the league)
Time weighted, cutoff of 300 minutes:
+1.38 (37th best in the league)
Possessions-weighted, no minutes cutoff:
+2.02 (36th best in the league)
Possessions-weighted, cutoff of 300 minutes:
+1.90 (36th best in the league)
Interestingly, with regularization, I also get Dampier to be playing quite well, with a rating similar to Garnett's (i.e. around +2 and good for 30th to 40th in the league).
Use APM without regularization at your own risk!
I can actually approximately reproduce Winston's ratings reported on TrueHoop in most cases, by not using regularization or a minutes cutoff and by using time-weighting. Here are the ratings he reports:
Garnett -6
Rasheed Wallace -1
Vince Carter + 9
Jason Williams +10
Jameer Nelson -2
Rashard Lewis -11
Mikael Pietrus -9
Erick Dampier -10
Drew Gooden -21
Kevin Durant +16.5
Joakim Noah -15
Luol Deng + 20
Brandon Jennings +2
Tyreke Evans -1
James Harden +4
Omri Casspi -6
Stephen Curry 0
Hasheem Thabeet + 10
Marcus Thornton +8
Dirk Nowitzki +26
Here are my results when I try to reproduce what Winston is doing (as I understand it, as explained above). There are certainly some differences, but it's qualitatively pretty similar in most cases:
Garnett -7.6
Rasheed Wallace -2.5
Vince Carter + 13.1
Jason Williams +7.5
Jameer Nelson -8.4
Rashard Lewis -9.9
Mikael Pietrus -2
Erick Dampier -8.3
Drew Gooden -20.3
Kevin Durant +19.1
Joakim Noah -14.2
Luol Deng + 21.8
Brandon Jennings +1.14
Tyreke Evans +0.1
James Harden +6.9
Omri Casspi -5.8
Stephen Curry 0.02
Hasheem Thabeet + 3.3
Marcus Thornton +14.9
Dirk Nowitzki +24.8
Back to top
View user's profile Send private message
Ryan J. Parker
Joined: 23 Mar 2007
Posts: 708
Location: Raleigh, NC
PostPosted: Tue Jan 05, 2010 8:57 pm Post subject: Reply with quote
Just curious, but do you happen to be using an R package to perform the regularization? Or something else?
_________________
I am a basketball geek.
Back to top
View user's profile Send private message Visit poster's website
jsill
Joined: 19 Aug 2009
Posts: 73
PostPosted: Tue Jan 05, 2010 9:03 pm Post subject: Reply with quote
I don't use R. I solve the appropriate linear system using the Python NumPy package.
Back to top
View user's profile Send private message
deepak
Joined: 26 Apr 2006
Posts: 664
PostPosted: Tue Jan 05, 2010 9:49 pm Post subject: Reply with quote
jsill, if you have the numbers at hand, would you mind posting what you got for the Rockets?
Just curious. Smile
Back to top
View user's profile Send private message
habetw4
Joined: 12 Nov 2009
Posts: 22
Location: CT
PostPosted: Tue Jan 05, 2010 11:24 pm Post subject: Reply with quote
Didn't know Aaron worked with the Grizzlies, either. Awesome news. Also, that was the first time I've ever seen Luol Deng in MVP talks. Probably a good chance it is the last.
Surprised to see this:
http://basketballvalue.com/topplayers. ... order=DESC
_________________
I'm a twitterererer: @tomhaberstroh.
DSMok1
Joined: 05 Aug 2009
Posts: 595
Location: Where the wind comes sweeping down the plains
PostPosted: Wed Jan 06, 2010 9:03 am Post subject: Reply with quote
Looking at KG from a Statistical +/- perspective: his SPM to date is 2.88--good but not great. That's fourth on the Celts, behind Rondo (5.41), Pierce (4.54) and 'Sheed (4.60).
Back to top
View user's profile Send private message Send e-mail Visit poster's website
IrishHand
Joined: 15 Jul 2009
Posts: 115
PostPosted: Wed Jan 06, 2010 10:12 am Post subject: Reply with quote
Qscience wrote:
You know to be honest Wayne really set himself up when he said those remarks about KDurant. If you do not study the game itself your stats are absolutely worthless to a professional. Those stats become an amatuerish view of the game and to be honest more self serving than truth.
Hopefully Wayne stops trying to make news with theories that are not tested and true because it really hurts quote this stat field in general.
Concur 100%.
Baffling to me that Abbott continues to use Winston as an authoritative source all things considered. I suppose sensational>accurate/insightful.
Back to top
View user's profile Send private message
gabefarkas
Joined: 31 Dec 2004
Posts: 1313
Location: Durham, NC
PostPosted: Wed Jan 06, 2010 2:42 pm Post subject: Reply with quote
habetw4 wrote:
Didn't know Aaron worked with the Grizzlies, either. Awesome news. Also, that was the first time I've ever seen Luol Deng in MVP talks. Probably a good chance it is the last.
Surprised to see this:
http://basketballvalue.com/topplayers.p ... order=DESC
What, specifically, about it?
Back to top
View user's profile Send private message Send e-mail AIM Address
jsill
Joined: 19 Aug 2009
Posts: 73
PostPosted: Wed Jan 06, 2010 3:05 pm Post subject: Reply with quote
Quote:
jsill, if you have the numbers at hand, would you mind posting what you got for the Rockets?
Just curious
OK, so bear in mind a few things as you look at these numbers. Most players are between -2 (that's about the 10th percentile) and +2 (that's about the 90th percentile). The very best in the league are up towards +4 or +5, and the very worst are around -4 or -5. Also, there's a lot of inevitable uncertainty in an estimate based on less than half a season. Remember also that 0 is a minutes-weighted average player, which means a fairly decent player (maybe 3rd or 4th best on a .500 team). So roughly speaking, it's a guy who is probably fairly priced around a mid-level salary or maybe even a little more.
This is with a minutes cutoff of 200 minutes.
Kyle Lowry 2.609
Chuck Hayes 1.987
Chase Budinger 1.045
David Andersen 0.733
Aaron Brooks -0.123
Carl Landry -0.127
Shane Battier -0.189
Trevor Ariza -0.923
Luis Scola -1.035
Back to top
View user's profile Send private message
deepak
Joined: 26 Apr 2006
Posts: 664
PostPosted: Wed Jan 06, 2010 3:52 pm Post subject: Reply with quote
jsill wrote:
Quote:
jsill, if you have the numbers at hand, would you mind posting what you got for the Rockets?
Just curious
OK, so bear in mind a few things as you look at these numbers. Most players are between -2 (that's about the 10th percentile) and +2 (that's about the 90th percentile). The very best in the league are up towards +4 or +5, and the very worst are around -4 or -5. Also, there's a lot of inevitable uncertainty in an estimate based on less than half a season. Remember also that 0 is a minutes-weighted average player, which means a fairly decent player (maybe 3rd or 4th best on a .500 team). So roughly speaking, it's a guy who is probably fairly priced around a mid-level salary or maybe even a little more.
This is with a minutes cutoff of 200 minutes.
Kyle Lowry 2.609
Chuck Hayes 1.987
Chase Budinger 1.045
David Andersen 0.733
Aaron Brooks -0.123
Carl Landry -0.127
Shane Battier -0.189
Trevor Ariza -0.923
Luis Scola -1.035
I appreciate it.
Is this possession-weighted, with minute cutoff?
Back to top
View user's profile Send private message
jsill
Joined: 19 Aug 2009
Posts: 73
PostPosted: Wed Jan 06, 2010 4:00 pm Post subject: Reply with quote
Yes, possessions-weighted, with a minutes cutoff of 200 minutes.
Back to top
View user's profile Send private message
habetw4
Joined: 12 Nov 2009
Posts: 22
Location: CT
PostPosted: Wed Jan 06, 2010 6:40 pm Post subject: Reply with quote
Quote:
habetw4 wrote:
Didn't know Aaron worked with the Grizzlies, either. Awesome news. Also, that was the first time I've ever seen Luol Deng in MVP talks. Probably a good chance it is the last.
Surprised to see this:
http://basketballvalue.com/topplayers.p ... order=DESC
What, specifically, about it?
I don't spend much time looking at plus/minus leaderboards and I hadn't heard MVP-level praise for Deng so it was a surprise to see him at the top of the list when he's performing at a level exactly in line with his statistical career norm.
_________________
I'm a twitterererer: @tomhaberstroh.
Back to top
View user's profile Send private message Send e-mail Visit poster's website
deepak
Joined: 26 Apr 2006
Posts: 664
PostPosted: Wed Jan 06, 2010 9:50 pm Post subject: Reply with quote
jsill wrote:
Yes, possessions-weighted, with a minutes cutoff of 200 minutes.
Thanks.
Your result for David Andersen serves as a good illustration of "Winston's Theorem", I think.
Andersen is a poor defender, rebounder, and a low-efficiency scorer. What he brings the Rockets at this stage is a floor-spacer at the 5 position. It looks like that attribute is important enough to offset all the things he doesn't do well. In particular, its given more spacing for the Rockets penetrators and for Landry to do his thing in the post.
Back to top
View user's profile Send private message
jsill
Joined: 19 Aug 2009
Posts: 73
PostPosted: Wed Jan 06, 2010 10:29 pm Post subject: Reply with quote
Quote:
Your result for David Andersen serves as a good illustration of "Winston's Theorem", I think.
Andersen is a poor defender, rebounder, and a low-efficiency scorer. What he brings the Rockets at this stage is a floor-spacer at the 5 position. It looks like that attribute is important enough to offset all the things he doesn't do well. In particular, its given more spacing for the Rockets penetrators and for Landry to do his thing in the post.
That's certainly plausible, but let's also not forget plain old estimation error (i.e. random noise) as a possibility. 35 games is not a lot of data, although (based on 08-09 experiments) I did find that you could get OK results (10-12% R-squared) predicting the rest of the season with a data set that small.
I'd also note that Andersen has a very low turnover rate (1.0 per 36 minutes).
Back to top
View user's profile Send private message
basketballvalue
Joined: 07 Mar 2006
Posts: 208
PostPosted: Thu Jan 07, 2010 10:49 am Post subject: Reply with quote
jsill wrote:
By the way, the thing I learned from that TrueHoop piece which made me happiest is that Aaron is working for the Grizzlies. Well, maybe that's old news to some of you, but not to me. Congrats to Aaron!
Thanks, I appreciate it. Interestingly, that quote from Winston led the local sports talk radio host in Memphis, Chris Vernon, to have me on his show yesterday. You can listen to it on his archive here if you're interested:
http://chrisvernon.blogspot.com/2010/01 ... aaron.html
I'm not so sure it's great radio, but special thanks go to kp0 (Kevin Pelton) for prompting me over gtalk so I didn't sound like an idiot as well as Henry for some general advice about interviewing.
To confirm some q's that came up on this thread, I do only rate about 2/3rds of the league, so the minutes are about 300 right now for the 1 year cutoff. Choosing that cutoff can have an impact on the adjusted results. The results are all per 100 possessions. The only adjusted numbers as labeled adjusted, things like Offensive Rating are unadjusted as you noted.
However, I feel I should mention that I personally tend to be wary of:
1. 1 year numbers (or 3/8 year numbers) due to the high noise, but I have it on bv.com because people always ask about it.
2. Situations where the adjustment has dramatically affected the net rating (overall on - overall off). Since I have KG at +8 per 100 possessions net (Celts +12 when he's on minus +4 when he's off), I'm comfortable that the 1 year number adjusted him down but only to about +3. You have to really trust all the adjustments to think that his true value is -6 when his net is +8.
3. Overvaluing the plus-minus results. I think it's a number that should be looked at, but really only one piece of the puzzle. It's what I have up on bv.com because I thought it was where I could make a contribution, not because I think it is the only way to look at it. My work for the Grizzlies involves a lot more than plus-minus.
Thanks,
Aaron
PS Sorry I haven't been so good at staying visible on the boards here, I'm trying to do better this year.
_________________
www.basketballvalue.com
Follow on Twitter
Back to top
View user's profile Send private message
jsill
Joined: 19 Aug 2009
Posts: 73
PostPosted: Thu Jan 07, 2010 3:07 pm Post subject: Reply with quote
I thought you sounded very smooth. Congrats on the interview!
The interview with Chris Wallace was also interesting. Interesting to hear that the stats guys (or at least, the stats guys he was talking to at the time) were high on Shelden Williams. Certainly, his conventional statistics looked great in college.
Joined: 20 Jan 2009
Posts: 795
PostPosted: Sun Nov 22, 2009 7:19 pm Post subject: Investigating the Winston Theorem Reply with quote
http://tomsbombs.blogspot.com/2009/10/d ... nston.html
Winston appears to mean 2 guys who can't hit an outside shot.
Thanks for the data.
Just starting to look at it.
As you say it doesn't offer strong support for the theorem but there would be other possible cuts at it or finding something close to it.
I've had similar questions about the impact on lineups of 2 guys low on usage, low overall TS% or high=percentage shot frequency or accuracy, etc. or maybe a combination and perhaps the match of perimeter and interior matters.
To isolate offense though it would be better to look at offensive efficiency of pairs compared to players without the another player rather than +/- also affected by defense. 82games player pair table allows that, right now for 08-09 but eventually again for this season I assume.
Last edited by Crow on Mon Nov 23, 2009 2:38 pm; edited 2 times in total
Back to top
View user's profile Send private message
habetw4
Joined: 12 Nov 2009
Posts: 22
Location: CT
PostPosted: Sun Nov 22, 2009 7:59 pm Post subject: Reply with quote
"My theory on the lineups that play worse is that they have two guys who can’t hit the broad side of a barn." Do you think he's only talking about offensive efficiency or the team overall? I think it's the latter.
Back to top
View user's profile Send private message Send e-mail Visit poster's website
Crow
Joined: 20 Jan 2009
Posts: 795
PostPosted: Sun Nov 22, 2009 8:01 pm Post subject: Reply with quote
He probably is thinking the weak offense leads to bad overall results but to isolate the effect I'd look at offensive efficiency first.
Back to top
View user's profile Send private message
Crow
Joined: 20 Jan 2009
Posts: 795
PostPosted: Sun Nov 22, 2009 8:16 pm Post subject: Reply with quote
Looking quickly at the 5 lineups that played 300+ minutes and had weak Offensive ratings I see they all have player usage rates than sum to less than 100%. I learned about this lineup trend at the XOHoops simulator.
Of course 5 lineups isn't proof but it is a hint.
These lineups average only 1 guy bad on mid-range FG%- compared to league average- but almost 2 who shot from mid-range at a high frequency. That's "guys who can’t hit the broad side of a barn" based on frequency of choosing a bad shot location.
As I noted in another thread the Offensive Adjusted +/- of the top 20 on mid-range frequency as a % of total shots in the league is 3 negative for every positive.
Winston wondered about Noah and Thomas and their outside shooting, in your other article http://www.hoopdata.com/recent.aspx?aid=45
you raise questions about Chicago's high rate of long 2s- which mainly come from the other 3 guys Rose, Gordon and Deng and the latter may well be more important. I raised the issue about sum total lineup usage. Put all three together and it is a perfect storm and not surprising that Chicago lineup of
Deng- Gordon- Noah- Rose- Thomas
pulled a 101.5 Offensive Rating last season and was allowed to disappear, perhaps more fortuitously than knowingly given that they substituted Salmons for Gordon and it is all the same complaints and pulling a 100 Offensive Rating as the third most used lineup though fortunately being used only about 3 minutes a game.
It is probably worth noting that my criteria Boston's most used lineup qualifies as only having 1 guy with high frequency of mid-range shots- Garnett and they pull a 113 Offensive rating. Substitute Sheed for Perkins and the Offensive rating drops to 103. Maybe when you take as many 3s as he is and his current eFG% it is essentially the same as shooting from mid-range... and harmful. By contrast Boston's second most used lineup has no excessive mid-range shooters and has an Offensive Rating of 127. Just one data point but I noticed that. Though there are some lineups over 100+ minutes in the league with high Offensive ratings with 2 or more frequent mid-range shooters. It probably isn't a hard and fast thing and there are surely other nuances- like the sum of usage that might mitigate (all but one appear to have sum of usage well above 100 ) as might the quality of mid-range shooting or the quality of the shooting from the high percentage zones.
Last edited by Crow on Sun Nov 22, 2009 9:47 pm; edited 10 times in total
Back to top
View user's profile Send private message
Qscience
Joined: 22 Jun 2009
Posts: 67
Location: Phoenix, Arizona
PostPosted: Sun Nov 22, 2009 8:56 pm Post subject: Reply with quote
You know to be honest Wayne really set himself up when he said those remarks about KDurant. If you do not study the game itself your stats are absolutely worthless to a professional. Those stats become an amatuerish view of the game and to be honest more self serving than truth.
Hopefully Wayne stops trying to make news with theories that are not tested and true because it really hurts quote this stat field in general.
Back to top
View user's profile Send private message Visit poster's website
deepak
Joined: 26 Apr 2006
Posts: 664
PostPosted: Sun Nov 22, 2009 10:22 pm Post subject: Reply with quote
I assumed he was referring to range shooting, not so much eFG%.
How many lineups that use two front-court players that don't shoot a lot from outside, say, 18 feet, are really effective on offense?
Back to top
View user's profile Send private message
Crow
Joined: 20 Jan 2009
Posts: 795
PostPosted: Sun Nov 22, 2009 11:12 pm Post subject: Reply with quote
Among heavily used and strong offensive lineups Horford-Smith might be about as low on non-inside shooting from the bigs as any other.
Among other strong offensive lineups low on non-inside shooting from the bigs I see Thomas-Collison and Shaq-Hickson.
Back to top
View user's profile Send private message
Mike G
Joined: 14 Jan 2005
Posts: 3535
Location: Hendersonville, NC
PostPosted: Tue Jan 05, 2010 6:13 pm Post subject: Reply with quote
Today on TrueHoop, I read:
Quote:
It's generally agreed that plus/minus stats need large numbers of games to be meaningful. Now that we have ten weeks of the NBA season under our belts, it's time to see what Winston's spreadsheets are saying about the season so far:
1. Who are the key Celtics this season?
Kevin Garnett is not the KG of the past. His adjusted plus/minus is minus-6 and his offense rating is minus 10.
This doesn't sound very familiar, so I look at
http://basketballvalue.com/teamplayers. ... 0&team=BOS
.. and I see Garnett at +5.91 for his 857 minutes this year.
His Offense is +1.29
How can various 'adjusted plus/minus' be that different?
_________________
`
36% of all statistics are wrong
Back to top
View user's profile Send private message Send e-mail
Ryan J. Parker
Joined: 23 Mar 2007
Posts: 708
Location: Raleigh, NC
PostPosted: Tue Jan 05, 2010 6:17 pm Post subject: Reply with quote
Wayne uses per 48 minutes. Pretty sure Aaron is using per 100 possessions.
_________________
I am a basketball geek.
Back to top
View user's profile Send private message Visit poster's website
deepak
Joined: 26 Apr 2006
Posts: 664
PostPosted: Tue Jan 05, 2010 6:22 pm Post subject: Reply with quote
Mike G wrote:
Today on TrueHoop, I read:
Quote:
It's generally agreed that plus/minus stats need large numbers of games to be meaningful. Now that we have ten weeks of the NBA season under our belts, it's time to see what Winston's spreadsheets are saying about the season so far:
1. Who are the key Celtics this season?
Kevin Garnett is not the KG of the past. His adjusted plus/minus is minus-6 and his offense rating is minus 10.
This doesn't sound very familiar, so I look at
http://basketballvalue.com/teamplayers. ... 0&team=BOS
.. and I see Garnett at +5.91 for his 857 minutes this year.
His Offense is +1.29
How can various 'adjusted plus/minus' be that different?
Not sure what the explanation for the discrepency in APM is. But the Off Rtg on basketballvalue is not adjusted (just On-court minus Off-court).
For the APM ratings to disagree by nearly 12 points seems very strange. Basketballvalue does show Garnett's Std Err to be the highest on the team, and 8th highest in the league.
Back to top
View user's profile Send private message
jsill
Joined: 19 Aug 2009
Posts: 73
PostPosted: Tue Jan 05, 2010 8:46 pm Post subject: Reply with quote
The discrepancy between Winston's results and basketballvalues's seems to be mostly a result of 2 things: weighting the game segments by clock time elapsed (as Ryan mentioned) and not using a general "reference player" to represent players who have not played many minutes. I am not sure of the minutes cutoff Aaron Barzilai is using at basketballvalue, but from eyeballing it, it looks like it's around 300 minutes. Winston mentioned at that NESSIS conference that he doesn't use the reference player approach.
By the way, the thing I learned from that TrueHoop piece which made me happiest is that Aaron is working for the Grizzlies. Well, maybe that's old news to some of you, but not to me. Congrats to Aaron!
I have implemented APM using a weighting by clock time elapsed (as well as the more commonly used possessions-weighting). I have run experiments based on this season alone, although they're not up on my site yet. If I don't use regularization and if I don't use a reference player but I do use time-weighting, I get Garnett at -7.6, a similar result to Winston's. This puts Garnett at 297th out of 419 players. If I continue to use time weighting but I use a minutes cutoff of 300 minutes, I get Garnett at -2.04, or 155th out of 291 players. If I use possessions weighting and a cutoff of 300 minutes, I get Garnett at + 6.6 (62nd place out of 291).
Well, these are the kinds of results you tend to get (i.e. parameter estimates which are rather unstable and overly sensitive to seemingly minor implementation choices) if you don't use regularization. You're going to overfit like crazy on less than half of one season.
If I do use an appropriately chosen regularization parameter, chosen via cross-validation, then these are the results I get for Garnett:
Time weighted, no minutes cutoff:
+1.48 (35th best in the league)
Time weighted, cutoff of 300 minutes:
+1.38 (37th best in the league)
Possessions-weighted, no minutes cutoff:
+2.02 (36th best in the league)
Possessions-weighted, cutoff of 300 minutes:
+1.90 (36th best in the league)
Interestingly, with regularization, I also get Dampier to be playing quite well, with a rating similar to Garnett's (i.e. around +2 and good for 30th to 40th in the league).
Use APM without regularization at your own risk!
I can actually approximately reproduce Winston's ratings reported on TrueHoop in most cases, by not using regularization or a minutes cutoff and by using time-weighting. Here are the ratings he reports:
Garnett -6
Rasheed Wallace -1
Vince Carter + 9
Jason Williams +10
Jameer Nelson -2
Rashard Lewis -11
Mikael Pietrus -9
Erick Dampier -10
Drew Gooden -21
Kevin Durant +16.5
Joakim Noah -15
Luol Deng + 20
Brandon Jennings +2
Tyreke Evans -1
James Harden +4
Omri Casspi -6
Stephen Curry 0
Hasheem Thabeet + 10
Marcus Thornton +8
Dirk Nowitzki +26
Here are my results when I try to reproduce what Winston is doing (as I understand it, as explained above). There are certainly some differences, but it's qualitatively pretty similar in most cases:
Garnett -7.6
Rasheed Wallace -2.5
Vince Carter + 13.1
Jason Williams +7.5
Jameer Nelson -8.4
Rashard Lewis -9.9
Mikael Pietrus -2
Erick Dampier -8.3
Drew Gooden -20.3
Kevin Durant +19.1
Joakim Noah -14.2
Luol Deng + 21.8
Brandon Jennings +1.14
Tyreke Evans +0.1
James Harden +6.9
Omri Casspi -5.8
Stephen Curry 0.02
Hasheem Thabeet + 3.3
Marcus Thornton +14.9
Dirk Nowitzki +24.8
Back to top
View user's profile Send private message
Ryan J. Parker
Joined: 23 Mar 2007
Posts: 708
Location: Raleigh, NC
PostPosted: Tue Jan 05, 2010 8:57 pm Post subject: Reply with quote
Just curious, but do you happen to be using an R package to perform the regularization? Or something else?
_________________
I am a basketball geek.
Back to top
View user's profile Send private message Visit poster's website
jsill
Joined: 19 Aug 2009
Posts: 73
PostPosted: Tue Jan 05, 2010 9:03 pm Post subject: Reply with quote
I don't use R. I solve the appropriate linear system using the Python NumPy package.
Back to top
View user's profile Send private message
deepak
Joined: 26 Apr 2006
Posts: 664
PostPosted: Tue Jan 05, 2010 9:49 pm Post subject: Reply with quote
jsill, if you have the numbers at hand, would you mind posting what you got for the Rockets?
Just curious. Smile
Back to top
View user's profile Send private message
habetw4
Joined: 12 Nov 2009
Posts: 22
Location: CT
PostPosted: Tue Jan 05, 2010 11:24 pm Post subject: Reply with quote
Didn't know Aaron worked with the Grizzlies, either. Awesome news. Also, that was the first time I've ever seen Luol Deng in MVP talks. Probably a good chance it is the last.
Surprised to see this:
http://basketballvalue.com/topplayers. ... order=DESC
_________________
I'm a twitterererer: @tomhaberstroh.
DSMok1
Joined: 05 Aug 2009
Posts: 595
Location: Where the wind comes sweeping down the plains
PostPosted: Wed Jan 06, 2010 9:03 am Post subject: Reply with quote
Looking at KG from a Statistical +/- perspective: his SPM to date is 2.88--good but not great. That's fourth on the Celts, behind Rondo (5.41), Pierce (4.54) and 'Sheed (4.60).
Back to top
View user's profile Send private message Send e-mail Visit poster's website
IrishHand
Joined: 15 Jul 2009
Posts: 115
PostPosted: Wed Jan 06, 2010 10:12 am Post subject: Reply with quote
Qscience wrote:
You know to be honest Wayne really set himself up when he said those remarks about KDurant. If you do not study the game itself your stats are absolutely worthless to a professional. Those stats become an amatuerish view of the game and to be honest more self serving than truth.
Hopefully Wayne stops trying to make news with theories that are not tested and true because it really hurts quote this stat field in general.
Concur 100%.
Baffling to me that Abbott continues to use Winston as an authoritative source all things considered. I suppose sensational>accurate/insightful.
Back to top
View user's profile Send private message
gabefarkas
Joined: 31 Dec 2004
Posts: 1313
Location: Durham, NC
PostPosted: Wed Jan 06, 2010 2:42 pm Post subject: Reply with quote
habetw4 wrote:
Didn't know Aaron worked with the Grizzlies, either. Awesome news. Also, that was the first time I've ever seen Luol Deng in MVP talks. Probably a good chance it is the last.
Surprised to see this:
http://basketballvalue.com/topplayers.p ... order=DESC
What, specifically, about it?
Back to top
View user's profile Send private message Send e-mail AIM Address
jsill
Joined: 19 Aug 2009
Posts: 73
PostPosted: Wed Jan 06, 2010 3:05 pm Post subject: Reply with quote
Quote:
jsill, if you have the numbers at hand, would you mind posting what you got for the Rockets?
Just curious
OK, so bear in mind a few things as you look at these numbers. Most players are between -2 (that's about the 10th percentile) and +2 (that's about the 90th percentile). The very best in the league are up towards +4 or +5, and the very worst are around -4 or -5. Also, there's a lot of inevitable uncertainty in an estimate based on less than half a season. Remember also that 0 is a minutes-weighted average player, which means a fairly decent player (maybe 3rd or 4th best on a .500 team). So roughly speaking, it's a guy who is probably fairly priced around a mid-level salary or maybe even a little more.
This is with a minutes cutoff of 200 minutes.
Kyle Lowry 2.609
Chuck Hayes 1.987
Chase Budinger 1.045
David Andersen 0.733
Aaron Brooks -0.123
Carl Landry -0.127
Shane Battier -0.189
Trevor Ariza -0.923
Luis Scola -1.035
Back to top
View user's profile Send private message
deepak
Joined: 26 Apr 2006
Posts: 664
PostPosted: Wed Jan 06, 2010 3:52 pm Post subject: Reply with quote
jsill wrote:
Quote:
jsill, if you have the numbers at hand, would you mind posting what you got for the Rockets?
Just curious
OK, so bear in mind a few things as you look at these numbers. Most players are between -2 (that's about the 10th percentile) and +2 (that's about the 90th percentile). The very best in the league are up towards +4 or +5, and the very worst are around -4 or -5. Also, there's a lot of inevitable uncertainty in an estimate based on less than half a season. Remember also that 0 is a minutes-weighted average player, which means a fairly decent player (maybe 3rd or 4th best on a .500 team). So roughly speaking, it's a guy who is probably fairly priced around a mid-level salary or maybe even a little more.
This is with a minutes cutoff of 200 minutes.
Kyle Lowry 2.609
Chuck Hayes 1.987
Chase Budinger 1.045
David Andersen 0.733
Aaron Brooks -0.123
Carl Landry -0.127
Shane Battier -0.189
Trevor Ariza -0.923
Luis Scola -1.035
I appreciate it.
Is this possession-weighted, with minute cutoff?
Back to top
View user's profile Send private message
jsill
Joined: 19 Aug 2009
Posts: 73
PostPosted: Wed Jan 06, 2010 4:00 pm Post subject: Reply with quote
Yes, possessions-weighted, with a minutes cutoff of 200 minutes.
Back to top
View user's profile Send private message
habetw4
Joined: 12 Nov 2009
Posts: 22
Location: CT
PostPosted: Wed Jan 06, 2010 6:40 pm Post subject: Reply with quote
Quote:
habetw4 wrote:
Didn't know Aaron worked with the Grizzlies, either. Awesome news. Also, that was the first time I've ever seen Luol Deng in MVP talks. Probably a good chance it is the last.
Surprised to see this:
http://basketballvalue.com/topplayers.p ... order=DESC
What, specifically, about it?
I don't spend much time looking at plus/minus leaderboards and I hadn't heard MVP-level praise for Deng so it was a surprise to see him at the top of the list when he's performing at a level exactly in line with his statistical career norm.
_________________
I'm a twitterererer: @tomhaberstroh.
Back to top
View user's profile Send private message Send e-mail Visit poster's website
deepak
Joined: 26 Apr 2006
Posts: 664
PostPosted: Wed Jan 06, 2010 9:50 pm Post subject: Reply with quote
jsill wrote:
Yes, possessions-weighted, with a minutes cutoff of 200 minutes.
Thanks.
Your result for David Andersen serves as a good illustration of "Winston's Theorem", I think.
Andersen is a poor defender, rebounder, and a low-efficiency scorer. What he brings the Rockets at this stage is a floor-spacer at the 5 position. It looks like that attribute is important enough to offset all the things he doesn't do well. In particular, its given more spacing for the Rockets penetrators and for Landry to do his thing in the post.
Back to top
View user's profile Send private message
jsill
Joined: 19 Aug 2009
Posts: 73
PostPosted: Wed Jan 06, 2010 10:29 pm Post subject: Reply with quote
Quote:
Your result for David Andersen serves as a good illustration of "Winston's Theorem", I think.
Andersen is a poor defender, rebounder, and a low-efficiency scorer. What he brings the Rockets at this stage is a floor-spacer at the 5 position. It looks like that attribute is important enough to offset all the things he doesn't do well. In particular, its given more spacing for the Rockets penetrators and for Landry to do his thing in the post.
That's certainly plausible, but let's also not forget plain old estimation error (i.e. random noise) as a possibility. 35 games is not a lot of data, although (based on 08-09 experiments) I did find that you could get OK results (10-12% R-squared) predicting the rest of the season with a data set that small.
I'd also note that Andersen has a very low turnover rate (1.0 per 36 minutes).
Back to top
View user's profile Send private message
basketballvalue
Joined: 07 Mar 2006
Posts: 208
PostPosted: Thu Jan 07, 2010 10:49 am Post subject: Reply with quote
jsill wrote:
By the way, the thing I learned from that TrueHoop piece which made me happiest is that Aaron is working for the Grizzlies. Well, maybe that's old news to some of you, but not to me. Congrats to Aaron!
Thanks, I appreciate it. Interestingly, that quote from Winston led the local sports talk radio host in Memphis, Chris Vernon, to have me on his show yesterday. You can listen to it on his archive here if you're interested:
http://chrisvernon.blogspot.com/2010/01 ... aaron.html
I'm not so sure it's great radio, but special thanks go to kp0 (Kevin Pelton) for prompting me over gtalk so I didn't sound like an idiot as well as Henry for some general advice about interviewing.
To confirm some q's that came up on this thread, I do only rate about 2/3rds of the league, so the minutes are about 300 right now for the 1 year cutoff. Choosing that cutoff can have an impact on the adjusted results. The results are all per 100 possessions. The only adjusted numbers as labeled adjusted, things like Offensive Rating are unadjusted as you noted.
However, I feel I should mention that I personally tend to be wary of:
1. 1 year numbers (or 3/8 year numbers) due to the high noise, but I have it on bv.com because people always ask about it.
2. Situations where the adjustment has dramatically affected the net rating (overall on - overall off). Since I have KG at +8 per 100 possessions net (Celts +12 when he's on minus +4 when he's off), I'm comfortable that the 1 year number adjusted him down but only to about +3. You have to really trust all the adjustments to think that his true value is -6 when his net is +8.
3. Overvaluing the plus-minus results. I think it's a number that should be looked at, but really only one piece of the puzzle. It's what I have up on bv.com because I thought it was where I could make a contribution, not because I think it is the only way to look at it. My work for the Grizzlies involves a lot more than plus-minus.
Thanks,
Aaron
PS Sorry I haven't been so good at staying visible on the boards here, I'm trying to do better this year.
_________________
www.basketballvalue.com
Follow on Twitter
Back to top
View user's profile Send private message
jsill
Joined: 19 Aug 2009
Posts: 73
PostPosted: Thu Jan 07, 2010 3:07 pm Post subject: Reply with quote
I thought you sounded very smooth. Congrats on the interview!
The interview with Chris Wallace was also interesting. Interesting to hear that the stats guys (or at least, the stats guys he was talking to at the time) were high on Shelden Williams. Certainly, his conventional statistics looked great in college.
Re: Recovered old threads- miscellaneous topics
deepak
Joined: 26 Apr 2006
Posts: 665
PostPosted: Thu Oct 23, 2008 3:12 pm Post subject: ESPN Magazine profile on Rockets GM Reply with quote
http://sports.espn.go.com/espnmag/story ... id=3658571
Quote:
...
Several teams, including the Nets, Nuggets and Cavaliers, consult a statistical analyst on personnel decisions, but the Rockets are the first to have built a division of numberjacks, and Morey is the league's first GM who is committed to the new science. His group's research is geared toward not only draft night and player acquisitions but also on-court combinations and coaching strategies.
Morey grew up reading Bill James' Baseball Abstract and later worked for the stats guru, but his geekier tendencies might actually have more to do with his boyhood love of comic book antiheroes who cut against the grain, figures like Frank Miller's Dark Knight. "In a league in which 30 teams are competing for one prize, you have to differentiate yourself somehow," Morey says. "We chose analytics."
...
Statistical analysis has instigated a culture war in baseball, with math whizzes positioning themselves against the status quo, hell-bent on puncturing long-held theories. But the hoops version of Moneyball is far more complementary. In fact, the analytics of the NBA often reinforce old-school concepts such as the "glue guy." The Battiers of the hoops world can be praised for more than their intangibles. In fact, their value can be concretely expressed. And that value often argues for a share-the-ball game that Norman Dale would adore. "Often, what Daryl presents us supports things we already feel are working or could work," says Adelman.
As Morey himself stresses constantly, his metrics are a tool—rather than the tool—for evaluation, one of many he and his coaches use. He is no robot churning out streams of data, nor is he a slave to his numbers. "There is more than one way to win, more than one way to see things," he says. "Through analysis, we're trying to give ourselves one more way to answer questions. But we combine those answers with what our coaches, players and scouts tell us."
Mountain
Joined: 13 Mar 2007
Posts: 1527
PostPosted: Thu Nov 13, 2008 2:04 am Post subject: Reply with quote
Last season Yao and McGrady were right at zero on adjusted +/- and the bench was great and appeared to be carrying them. So far the big 2 are rating that way and with Artest are getting virtually all the adjusted credit. RonRon is by far the leader on adjusted and a smashing success.
But Brooks -14, Alston -12 and Landry -49 and Scola -35.
Prior to current season profile experienced a night and day change by this method, of course small current sample.
Did the Rockets gain or lose net? How much will things change with time?
Back to top
View user's profile Send private message
deepak
Joined: 26 Apr 2006
Posts: 664
PostPosted: Thu Nov 13, 2008 2:13 am Post subject: Reply with quote
Mountain wrote:
Last season Yao and McGrady were right at zero on adjusted +/- and the bench was great and appeared to be carrying them. So far the big 2 are rating that way and with Artest are getting virtually all the adjusted credit. RonRon is by far the leader on adjusted and a smashing success.
But Brooks -14, Alston -12 but Landry -49 and Scola -35.
Prior to current season profile experienced a night and day change by this method, of course small current sample.
Did the Rockets gain or lose net? How much will things change with time?
I don't think the APM tells us anything this early. A number of Rockets players are slumping offensively to start the season, and guys aren't fully healthy. Ron Artest is still trying to find himself in the Rockets offense. The Rockets like how Brooks has played quite a lot. He's been a consistent scoring threat off the bench. The rest of the team has been up and down.
Statistically, the one area in which the Rockets have improved dramatically (at least early on) is in free throw shooting. They were one of the worst free throw teams last year, and this season they're leading the league in FT%. Go figure.
Back to top
View user's profile Send private message
Mountain
Joined: 13 Mar 2007
Posts: 1527
PostPosted: Thu Nov 13, 2008 2:32 am Post subject: Reply with quote
APM may not tell us anything (or much, solid) this early but early APM can help us look at things to see if any of them tell us anything eventually.
Ming. McGrady & Artest the usage leaders but in bottom half of team on TS%. If they took fewer shots, the better shots would the team be better, would they as individuals look even better by APM or just get less of the credit?
Brooks in top 4 on TS% (so it is not a reliable mover of the adjusted needle by itself always) but for some reason still a dud on adjusted, in fact significantly worse than last season so far. Is his good offense negated solely by his defensive impact or also his impact on the offensive contribution of others? The raw data seemly supports the negative impact on defense but it appears to be from team impact as counterpart defense is fine. A small PG particularly harmful as a help defender? Maybe move him in the rotation fo reven more defensive compensation?
Scola and Landry were and still are efficient scorers but each had a big negative swing in adjusted. Maybe it comes back around. By the raw on/off data the team defense or luck when on the court is a big factor is this change but Landry may also by having some negative impact (or experience?) in the lineups he is in. Maybe move them in the rotation too?
Can you truly optimize them to their max individual level and the big 3 or just settle for optimizing the big 3 and minimize the other damage?
Was this a philosophical or strategic change operationalized or did this just happen to the Rockets (so far) regardless of what management was trying to do? Or it could mostly or entirely be small sample adjusted +/- noise. But regardless of the answer I think it is a decent question worth trying to answer later.
Last edited by Mountain on Fri Nov 14, 2008 2:08 pm; edited 1 time in total
Back to top
View user's profile Send private message
deepak
Joined: 26 Apr 2006
Posts: 664
PostPosted: Thu Nov 13, 2008 1:33 pm Post subject: Reply with quote
Mountain wrote:
APM may not tell us anything (or much, solid) this early but early APM can help us look at things to see if any of them tell us anything eventually.
Ming. McGrady Artest the usage leaders but in bottom half of team on TS%. If they took fewer shots, the better shots would th eteam be better, would they look even better or just get less of the credit?
The Rockets don't have a lot of players capable of creating shots for themselves. It's T-Mac, Artest, Brooks, maybe Yao if he gets good post position, and Rafer on occasion. That's about it. For example, in the starting lineup Scola has shot the best from the field, but the vast majority of his shots come about through the playmaking of others. So, if the coaches choose to reduce the role of the less efficient players, that could easily have an adverse effect on the rest for this team.
Quote:
Brooks in top 4 on TS% (so it is not a reliable mover of the adjusted needle by itself always) but for some reason still a dud on adjusted, in fact significantly worse than last season so far. Is his good offense negated solely by his defensive impact or also his impact on the offensive contribution of others? The raw data seemly supports the negative impact on defense but it appears to be from team impact as counterpart defense is fine. A small PG particularly harmful as a help defender? Maybe move him in the rotation fo reven more defensive compensation?
I don't really have a good feel for what APM is telling us so early in the season. A few good or bad stretches could throw the numbers way off, I suspect. So I don't see much value in paying much attention to them at this point. Here's what I know about Brooks: excellent penetrator, well developed midrange game, excellent range on his jump shot, good spot up shooter and very good shooter off the dribble, very strong in transition because of his speed, on drives will look to score first and pass second, can be sloppy with the ball at times, poor one on one defender, doesn't contest shots well, will take charges on occasion, doesn't go for steals very much.
All of that, to me, adds up to a very good energizer player off the bench; a guy who against certain matchups can play the point or off-guard position. If the team is struggling to get good looks at the basket, he's someone who can generate good looks from his exceptional one-on-one abilities. He'd be less effective in a starting role alongside Tracy McGrady and against an opposing teams starting PG. He's not going to fare well against PGs who can post up (e.g. Baron Davis, Chauncey Billups). But he battles, and he has tons of confidence.
Quote:
Scola and Landry were and still are efficient scorers but each had a big negative swing in adjusted. Maybe it comes back around. By the raw on/off data the team defense or luck when on the court is a big factor is this change but Landry may also by having some negative impact (or experience?) in the lineups he is in. Maybe move them in the rotation too?
Scola and Landry have had issues with foul trouble, and against various teams they've taken turns struggling on defense. Particularly when Yao or Chuck Hayes is not in the game, they've had a tough time stopping opposing teams in the interior. Neither is a solid post-up option .. they depend on other players to generate shots for them mostly. Landry has struggled keeping his guy off the offensive boards, from my observation. Scola can be streaky with his scoring. They both provide bundles of energy, though.
Quote:
Can you truly optimize them to their max individual level and the big 3 or just settle for optimizing the big 3 and minimize the other damage?
Was this a philosophical or strategic change operationalized or did this just happen to the Rockets (so far) regardless of what management was trying to do?
I think if the Big Three (particularly McGrady and Yao) are playing at a high level, then everything should actually come easier for the rest of the players. In my opinion, the Rockets need their stars to play more efficiently at their current usage levels.
Back to top
View user's profile Send private message
Mountain
Joined: 13 Mar 2007
Posts: 1527
PostPosted: Thu Nov 13, 2008 1:49 pm Post subject: Reply with quote
Thanks for the detail from regular observation.
I might try to shift more aggressively to Ming. Scola and Landry than you or the coach but acknowledge there is a balancing act.
I guess it comes down to what type shots the high efficiency guys get and if they are so heavily dependent on play-action off others. There are games where they go beyond their normal shot totals and do fine. Maybe it is mostly heightened opportunity off play-action, maybe it is also or mostly being more assertive in making their own opportunities, I admit I do not know. If they could more of those same types shots with more effort from the others or get other shots they could also be efficient on or at least more efficient than the least efficient on the team (trying to do too much?) there could be gains.
Plenty of time to sort it out but sort it out by playoffs they must to go far.
Full skill curves would be better but 70% of the time that Scola has gotten 10 shots he has hit 50+FG% (21 of 30 times). And he is 8 for 9 when getting 15+ shots. Landry is 6 for 6 when getting 10+ shots. Now getting and taking shots can be different but I'd push it and find out. If McGrady and Artest can help others, I'd think an even greater threat from Scola and Landry would help them some too.
From an earlier thread
David Sparks:
"Mountain: Your McGrady question inspired me to do a little experiment. In my sample of 749 games in which McGrady played, I compared his Scorer Rating to his Perimeter Rating. In 301 of those games, the Perimeter rating was greater than the Scorer Rating. I did a simple t-test, comparing his team's scoring margin in games in which he was more Perimeter versus games in which he was more Scoring. Average margin in Scoring-priority games was 0.97, for Perimeter-priority games, it was 2.41. P-value was very significant.
I thought I'd look at some other players, format is (Player,Scoring-priority mean margin, Perimeter-priority mean margin, significance @ 0.05?):
Kobe Bryant, 2.606, 7.05, sig
Allen Iverson, -0.593, 2.035, sig
Michael Jordan, 4.449, 7.550, sig
LeBron James, -1.45, 2.73, sig
Looks like a pattern, but I'm not sure what it means. Causality could go any number of ways, too, so take it with a grain of salt."
No simple statement will suffice here but stars will sometimes overdo the scoring priority (for various reasons). But of these McGrady's spread is tighter than all but LeBron.
Houston back to about average on FT/FG.
McGrady for the moment cutting back on shot attempts though he and Artest need to either hit more or pass more.
...
Then again, should the Rockets succeed, it would be a watershed moment for analytics. In a copycat league, other teams would surely follow Morey's winning model. "The commitment Houston has made makes them a test case," says Ken Catanella, the Nets' coordinator of statistical analysis. "How well they do could say a lot about how this field develops."
...
Back to top
View user's profile Send private message
Mountain
Joined: 13 Mar 2007
Posts: 1527
PostPosted: Thu Oct 23, 2008 3:38 pm Post subject: Reply with quote
Rockets will be interesting to watch and analyze.
Risk-taking trading for Artest is one thing. Trading away McGrady or Yao would be another level. How seriously considered? How seriously do the numbers suggest it should be considered? I'd consider those things heavily from all angles. If not now, next July.
You could say McGrady and Yao were already there and are hard to get equal value for ... or you could explore trades hard anyways,mostly for McGrady. Though Yao would be easier to get value for. Would the owner and President of the Warriors have said no to Yao / Alston for Davis / Harrington (with more use of Scola) and whatever filler was needed in the deal? Always options, half-baked or better.
Rockets fate from here affected by overall chemistry and leadership at PG. Alston decent but may or may not be enough. Looking at Rockets PGs you could guess PG defense is valued highly (Alston, Jackson) or it isn't (Mcgrady Brooks Barry) or that the mix is deemed acceptable. Being a decent frequent 3 point matters fairly significantly (Alston Brooks Jackson)... but driving the lane does not (Alston Brooks Jackson Barry even McGrady much of the time) or does not fit the rest of the team design / floor reality? Above average rebounding is sought (Alston Jackson the Francis hope att the time) but above average assist-making from the PG isn't a big deal (all of them)?
What level of PG could they get for McGrady? Probably not enough... though Kidd might have been interesting (perhaps in a multi-team deal).
Rockets interior cloggers do great on defense but maybe a double-edged sword doing the same on offense some. A PF who can hit the three, pass, move, drive would seem a fairly obvious target to try to add to the roster options. And not a rookie. Artest could well be that ticket.
"On a typical scoring play, you can divvy up the credit much more precisely than we've done in the past," says Dan Rosenbaum, a part-time adviser to the Cavaliers who is also a senior economist in the White House Office of Management and Budget. "You need to account for the guy who set the pick, the guy who made the pass, the guy who set up in the corner to spread the floor, the guy who cleared space by moving down the lane—and that's just the offense."
You can let adjusted +/- find it or you can think about it directly and have a credit / blame assignment accounting table (based on regression or subjective or a combo) going beyond what I've suggested before and protrade had a version of for a brief time. Or do both and compare. Does the former look /feel more accurate to the basketball guys and less subject to the noise / error of adjusted +/- ? Why not check.
Last edited by Mountain on Thu Oct 23, 2008 5:29 pm; edited 10 times in total
Back to top
View user's profile Send private message
Ryan J. Parker
Joined: 23 Mar 2007
Posts: 711
Location: Raleigh, NC
PostPosted: Thu Oct 23, 2008 3:51 pm Post subject: Reply with quote
That's a good read, although I do have one question: Can't we consider the Celtics a successful example of analytics?
I'm sure it's hard for the mainstream to look past KG, Pierce and Allen, but I'd like to think there were some analytic components that helped them win the championship.
Clearly the Rockets are the biggest spenders, but that doesn't mean if they don't win a championship we can't consider their techniques successful in making them a better team.
_________________
I am a basketball geek.
Back to top
View user's profile Send private message Visit poster's website
gabefarkas
Joined: 31 Dec 2004
Posts: 1313
Location: Durham, NC
PostPosted: Fri Nov 07, 2008 1:33 pm Post subject: Reply with quote
I love that nickname. Numberjacks.
I'd never heard it before, but I propose we all adopt it post-haste!
Back to top
View user's profile Send private message Send e-mail AIM Address
Mountain
Joined: 13 Mar 2007
Posts: 1527
PostPosted: Fri Nov 07, 2008 2:36 pm Post subject: Reply with quote
"Hijackers" for those who take something too far from where it belonged, "Lojack"ers who guide the recovery?
In perhaps related news PGs for Rockets double their counterpart point advantage compared to last season but triple their counterpart PER deficit.
But then Rockets SGs have lost ground on scoring but made a strong move to the positive on counterpart PER. I guess I could back off some on McGrady's TS% and recognize that he is doing some things right- passing and playing 1 on 1 defense. But then I see an on/off of -35 and both team offense and team defense double digits worse with McGrady on vs off so I'll wait to see how much I should back off on the main SG the Rockets continue to go to battle with. In the bottom third on team for raw +/- and -4 on adjusted.
Brooks great on raw but worse than McGrady on adjusted. Alston far far worse.
Yao leading the way on adjusted so far, despite lowest since rookie season shots attempts and by far career worse FG%. I'd take care of him more, get him more and better shots over the shot happy guards. Artest is #2 in value and while I'd tighten his shots too at least he is offsetting his overshooting otherwise.
Yao, Scola, Landry getting about 28 shots per game so far. It was about 30 last season. I'd think it could and should be 33+ ideally.
Back to top
View user's profile Send private message
Serhat Ugur (hoopseng)
Joined: 13 Oct 2006
Posts: 208
Location: Basketball Research
PostPosted: Fri Nov 07, 2008 5:59 pm Post subject: Re: ESPN Magazine profile on Rockets GM Reply with quote
Quote:
Several teams, including the Nets (Ken Catanella), Nuggets (Dean Oliver) and Cavaliers (Dan Rosenbaum) consult a statistical analyst on personnel decisions...
Let's complete the full list! What other teams employ consultant(s)?
+ Celtics (Mike Zarren)
_________________
http://www.nbastuffer.com
Back to top
View user's profile Send private message Visit poster's website
Mountain
Joined: 13 Mar 2007
Posts: 1527
PostPosted: Fri Nov 07, 2008 6:21 pm Post subject: Reply with quote
Correct me if I am wrong:
Previously revealed
Cavs David Lewin
Rockets Ed Kupfer
Portland Jeff Ma (I think, to some degree)
Other
(I think I know who but won't say right now)
Eli Witus
David Sparks
Roland Beech (not absolutely sure which one or several)
There is more and apparently more coming.
If a team wants new ideas, collaboration to push existing projects further or tough questions aimed at maximum awareness and advancement, drop me a private message here.
Last edited by Mountain on Sat Nov 08, 2008 2:48 pm; edited 3 times in total
Back to top
View user's profile Send private message
Serhat Ugur (hoopseng)
Joined: 13 Oct 2006
Posts: 208
Location: Basketball Research
PostPosted: Fri Nov 07, 2008 7:07 pm Post subject: Reply with quote
Mountain wrote:
(I think I know but won't say)
Eli Witus
David Sparks
I remember both of them revealed their teams?
_________________
http://www.nbastuffer.com
Back to top
View user's profile Send private message Visit poster's website
Mountain
Joined: 13 Mar 2007
Posts: 1527
PostPosted: Fri Nov 07, 2008 8:46 pm Post subject: Reply with quote
I think it was revealed. I pulled back because I wasn't absolutely sure without checking further it was directly by them and I was trying to be cautious / respectful.
Back to top
View user's profile Send private message
Mountain
Joined: 13 Mar 2007
Posts: 1527
PostPosted: Sat Nov 08, 2008 1:28 am Post subject: Reply with quote
McGrady, Artest, Brooks and Alston 12-41. 29% FG%.
Yao, Scola, Landry actually get 36 shots (given McGrady's 5 shot night) and go 20-36. 56% FG%.
Rockets 28th on team eFG% going into the game.
Maybe an abnormal low but...
17th last season.
7 of top 8 playoff teams were top 15 and 6 were top 10.
Cavs bucked the pattern despite being 26th with the strong defense but this would have to be considered the leading cause of falling 2 steps short of their ultimate goal.
Shots not movable without limit of course but move a couple here and there and you could make a significant shift and meaningful impact. Major challenge to sort this out.
Landry career high field goal attempts and 2nd highest point night. Demonstrates ability to be more than a 5-7 shot guy? One game not enough but I'd try to maximize him given his efficiency. Before some others -but not these next two.
Scola had his 5th biggest scoring night 3 days ago. I think Scola and Landry have figured out to take more shots.
Of course Yao should be doing this too. Maybe he isn't ready yet.
Wonder what the coaches and management are saying and doing as this point. Of course it is early so panic is not the proper response but better to recognize things and straight it out as soon possible so bad patterns don't harden.
Last edited by Mountain on Sat Nov 08, 2008 2:47 am; edited 3 times in total
Back to top
View user's profile Send private message
John Hollinger
Joined: 14 Feb 2005
Posts: 175
PostPosted: Sat Nov 08, 2008 1:35 am Post subject: Reply with quote
Blazers are using somebody else, actually -- not sure if that's instead of Ma or in addition to.
Back to top
View user's profile Send private message AIM Address
Mountain
Joined: 13 Mar 2007
Posts: 1527
PostPosted: Sat Nov 08, 2008 2:50 am Post subject: Reply with quote
"Can't we consider the Celtics a successful example of analytics?"
I'd assume so but as you say how much impact is hard to know from the outside.
Looks like they got just about everything right by one means or another- traditional or new, straightforward or complicated.
Ainge appears to have gotten the brain typing right too as just about everyone fit their role well and formed a unified productive team. I had some doubts about several parts- Doc, Ray, Perkins- but they worked out.
Or maybe it would be more accurate to say they got some things so right (Garnett, defense) that if other things weren't that good it was harder to dwell on them.
Celtics' big 3 on usage all at about 58% TS% is nice construction. That isn't complicated to identify and seek but it takes lots of work & discipline to realize.
Other teams handled this task well too.
Orlando's shot distribution was also proper and extremely balanced & deep. Some combination of forces deserve praise.
Same for Utah.
Don't know if Mitch Kupchak has a separate analytical staff but that organization also did a very fine job with shot distribution.
Certainly coaches should get a good share of the credit.
Phoenix of course did this part well too.
This was not what held Denver back.
Other contenders weren't as strong on this.
Last edited by Mountain on Sat Nov 08, 2008 5:20 pm; edited 1 time in total
Back to top
View user's profile Send private message
iamawesomer
Joined: 01 Sep 2008
Posts: 18
PostPosted: Sat Nov 08, 2008 3:49 am Post subject: Reply with quote
Roland was with the Mavs when I spoke to him last month.
Back to top
View user's profile Send private message
Mountain
Joined: 13 Mar 2007
Posts: 1527
PostPosted: Sat Nov 08, 2008 1:33 pm Post subject: Reply with quote
Which reminds of Winston / Sagarin. Who I assume but don't know for a fact are still associated with the Mavs.
Depending on how you define this I'd think others who maintain and study databases for teams qualify.
Back to top
View user's profile Send private message
Mountain
Joined: 13 Mar 2007
Posts: 1527
PostPosted: Sat Nov 08, 2008 9:11 pm Post subject: Reply with quote
Rockets near the top on FT/FG so far this season (after being 27th last season), which offsets current eFG% weakness. Will one or both last?
Cavs were bottom 10 weak on both last season but are top 10 on both right now. Will one or both last?
Back to top
View user's profile Send private message
Joined: 26 Apr 2006
Posts: 665
PostPosted: Thu Oct 23, 2008 3:12 pm Post subject: ESPN Magazine profile on Rockets GM Reply with quote
http://sports.espn.go.com/espnmag/story ... id=3658571
Quote:
...
Several teams, including the Nets, Nuggets and Cavaliers, consult a statistical analyst on personnel decisions, but the Rockets are the first to have built a division of numberjacks, and Morey is the league's first GM who is committed to the new science. His group's research is geared toward not only draft night and player acquisitions but also on-court combinations and coaching strategies.
Morey grew up reading Bill James' Baseball Abstract and later worked for the stats guru, but his geekier tendencies might actually have more to do with his boyhood love of comic book antiheroes who cut against the grain, figures like Frank Miller's Dark Knight. "In a league in which 30 teams are competing for one prize, you have to differentiate yourself somehow," Morey says. "We chose analytics."
...
Statistical analysis has instigated a culture war in baseball, with math whizzes positioning themselves against the status quo, hell-bent on puncturing long-held theories. But the hoops version of Moneyball is far more complementary. In fact, the analytics of the NBA often reinforce old-school concepts such as the "glue guy." The Battiers of the hoops world can be praised for more than their intangibles. In fact, their value can be concretely expressed. And that value often argues for a share-the-ball game that Norman Dale would adore. "Often, what Daryl presents us supports things we already feel are working or could work," says Adelman.
As Morey himself stresses constantly, his metrics are a tool—rather than the tool—for evaluation, one of many he and his coaches use. He is no robot churning out streams of data, nor is he a slave to his numbers. "There is more than one way to win, more than one way to see things," he says. "Through analysis, we're trying to give ourselves one more way to answer questions. But we combine those answers with what our coaches, players and scouts tell us."
Mountain
Joined: 13 Mar 2007
Posts: 1527
PostPosted: Thu Nov 13, 2008 2:04 am Post subject: Reply with quote
Last season Yao and McGrady were right at zero on adjusted +/- and the bench was great and appeared to be carrying them. So far the big 2 are rating that way and with Artest are getting virtually all the adjusted credit. RonRon is by far the leader on adjusted and a smashing success.
But Brooks -14, Alston -12 and Landry -49 and Scola -35.
Prior to current season profile experienced a night and day change by this method, of course small current sample.
Did the Rockets gain or lose net? How much will things change with time?
Back to top
View user's profile Send private message
deepak
Joined: 26 Apr 2006
Posts: 664
PostPosted: Thu Nov 13, 2008 2:13 am Post subject: Reply with quote
Mountain wrote:
Last season Yao and McGrady were right at zero on adjusted +/- and the bench was great and appeared to be carrying them. So far the big 2 are rating that way and with Artest are getting virtually all the adjusted credit. RonRon is by far the leader on adjusted and a smashing success.
But Brooks -14, Alston -12 but Landry -49 and Scola -35.
Prior to current season profile experienced a night and day change by this method, of course small current sample.
Did the Rockets gain or lose net? How much will things change with time?
I don't think the APM tells us anything this early. A number of Rockets players are slumping offensively to start the season, and guys aren't fully healthy. Ron Artest is still trying to find himself in the Rockets offense. The Rockets like how Brooks has played quite a lot. He's been a consistent scoring threat off the bench. The rest of the team has been up and down.
Statistically, the one area in which the Rockets have improved dramatically (at least early on) is in free throw shooting. They were one of the worst free throw teams last year, and this season they're leading the league in FT%. Go figure.
Back to top
View user's profile Send private message
Mountain
Joined: 13 Mar 2007
Posts: 1527
PostPosted: Thu Nov 13, 2008 2:32 am Post subject: Reply with quote
APM may not tell us anything (or much, solid) this early but early APM can help us look at things to see if any of them tell us anything eventually.
Ming. McGrady & Artest the usage leaders but in bottom half of team on TS%. If they took fewer shots, the better shots would the team be better, would they as individuals look even better by APM or just get less of the credit?
Brooks in top 4 on TS% (so it is not a reliable mover of the adjusted needle by itself always) but for some reason still a dud on adjusted, in fact significantly worse than last season so far. Is his good offense negated solely by his defensive impact or also his impact on the offensive contribution of others? The raw data seemly supports the negative impact on defense but it appears to be from team impact as counterpart defense is fine. A small PG particularly harmful as a help defender? Maybe move him in the rotation fo reven more defensive compensation?
Scola and Landry were and still are efficient scorers but each had a big negative swing in adjusted. Maybe it comes back around. By the raw on/off data the team defense or luck when on the court is a big factor is this change but Landry may also by having some negative impact (or experience?) in the lineups he is in. Maybe move them in the rotation too?
Can you truly optimize them to their max individual level and the big 3 or just settle for optimizing the big 3 and minimize the other damage?
Was this a philosophical or strategic change operationalized or did this just happen to the Rockets (so far) regardless of what management was trying to do? Or it could mostly or entirely be small sample adjusted +/- noise. But regardless of the answer I think it is a decent question worth trying to answer later.
Last edited by Mountain on Fri Nov 14, 2008 2:08 pm; edited 1 time in total
Back to top
View user's profile Send private message
deepak
Joined: 26 Apr 2006
Posts: 664
PostPosted: Thu Nov 13, 2008 1:33 pm Post subject: Reply with quote
Mountain wrote:
APM may not tell us anything (or much, solid) this early but early APM can help us look at things to see if any of them tell us anything eventually.
Ming. McGrady Artest the usage leaders but in bottom half of team on TS%. If they took fewer shots, the better shots would th eteam be better, would they look even better or just get less of the credit?
The Rockets don't have a lot of players capable of creating shots for themselves. It's T-Mac, Artest, Brooks, maybe Yao if he gets good post position, and Rafer on occasion. That's about it. For example, in the starting lineup Scola has shot the best from the field, but the vast majority of his shots come about through the playmaking of others. So, if the coaches choose to reduce the role of the less efficient players, that could easily have an adverse effect on the rest for this team.
Quote:
Brooks in top 4 on TS% (so it is not a reliable mover of the adjusted needle by itself always) but for some reason still a dud on adjusted, in fact significantly worse than last season so far. Is his good offense negated solely by his defensive impact or also his impact on the offensive contribution of others? The raw data seemly supports the negative impact on defense but it appears to be from team impact as counterpart defense is fine. A small PG particularly harmful as a help defender? Maybe move him in the rotation fo reven more defensive compensation?
I don't really have a good feel for what APM is telling us so early in the season. A few good or bad stretches could throw the numbers way off, I suspect. So I don't see much value in paying much attention to them at this point. Here's what I know about Brooks: excellent penetrator, well developed midrange game, excellent range on his jump shot, good spot up shooter and very good shooter off the dribble, very strong in transition because of his speed, on drives will look to score first and pass second, can be sloppy with the ball at times, poor one on one defender, doesn't contest shots well, will take charges on occasion, doesn't go for steals very much.
All of that, to me, adds up to a very good energizer player off the bench; a guy who against certain matchups can play the point or off-guard position. If the team is struggling to get good looks at the basket, he's someone who can generate good looks from his exceptional one-on-one abilities. He'd be less effective in a starting role alongside Tracy McGrady and against an opposing teams starting PG. He's not going to fare well against PGs who can post up (e.g. Baron Davis, Chauncey Billups). But he battles, and he has tons of confidence.
Quote:
Scola and Landry were and still are efficient scorers but each had a big negative swing in adjusted. Maybe it comes back around. By the raw on/off data the team defense or luck when on the court is a big factor is this change but Landry may also by having some negative impact (or experience?) in the lineups he is in. Maybe move them in the rotation too?
Scola and Landry have had issues with foul trouble, and against various teams they've taken turns struggling on defense. Particularly when Yao or Chuck Hayes is not in the game, they've had a tough time stopping opposing teams in the interior. Neither is a solid post-up option .. they depend on other players to generate shots for them mostly. Landry has struggled keeping his guy off the offensive boards, from my observation. Scola can be streaky with his scoring. They both provide bundles of energy, though.
Quote:
Can you truly optimize them to their max individual level and the big 3 or just settle for optimizing the big 3 and minimize the other damage?
Was this a philosophical or strategic change operationalized or did this just happen to the Rockets (so far) regardless of what management was trying to do?
I think if the Big Three (particularly McGrady and Yao) are playing at a high level, then everything should actually come easier for the rest of the players. In my opinion, the Rockets need their stars to play more efficiently at their current usage levels.
Back to top
View user's profile Send private message
Mountain
Joined: 13 Mar 2007
Posts: 1527
PostPosted: Thu Nov 13, 2008 1:49 pm Post subject: Reply with quote
Thanks for the detail from regular observation.
I might try to shift more aggressively to Ming. Scola and Landry than you or the coach but acknowledge there is a balancing act.
I guess it comes down to what type shots the high efficiency guys get and if they are so heavily dependent on play-action off others. There are games where they go beyond their normal shot totals and do fine. Maybe it is mostly heightened opportunity off play-action, maybe it is also or mostly being more assertive in making their own opportunities, I admit I do not know. If they could more of those same types shots with more effort from the others or get other shots they could also be efficient on or at least more efficient than the least efficient on the team (trying to do too much?) there could be gains.
Plenty of time to sort it out but sort it out by playoffs they must to go far.
Full skill curves would be better but 70% of the time that Scola has gotten 10 shots he has hit 50+FG% (21 of 30 times). And he is 8 for 9 when getting 15+ shots. Landry is 6 for 6 when getting 10+ shots. Now getting and taking shots can be different but I'd push it and find out. If McGrady and Artest can help others, I'd think an even greater threat from Scola and Landry would help them some too.
From an earlier thread
David Sparks:
"Mountain: Your McGrady question inspired me to do a little experiment. In my sample of 749 games in which McGrady played, I compared his Scorer Rating to his Perimeter Rating. In 301 of those games, the Perimeter rating was greater than the Scorer Rating. I did a simple t-test, comparing his team's scoring margin in games in which he was more Perimeter versus games in which he was more Scoring. Average margin in Scoring-priority games was 0.97, for Perimeter-priority games, it was 2.41. P-value was very significant.
I thought I'd look at some other players, format is (Player,Scoring-priority mean margin, Perimeter-priority mean margin, significance @ 0.05?):
Kobe Bryant, 2.606, 7.05, sig
Allen Iverson, -0.593, 2.035, sig
Michael Jordan, 4.449, 7.550, sig
LeBron James, -1.45, 2.73, sig
Looks like a pattern, but I'm not sure what it means. Causality could go any number of ways, too, so take it with a grain of salt."
No simple statement will suffice here but stars will sometimes overdo the scoring priority (for various reasons). But of these McGrady's spread is tighter than all but LeBron.
Houston back to about average on FT/FG.
McGrady for the moment cutting back on shot attempts though he and Artest need to either hit more or pass more.
...
Then again, should the Rockets succeed, it would be a watershed moment for analytics. In a copycat league, other teams would surely follow Morey's winning model. "The commitment Houston has made makes them a test case," says Ken Catanella, the Nets' coordinator of statistical analysis. "How well they do could say a lot about how this field develops."
...
Back to top
View user's profile Send private message
Mountain
Joined: 13 Mar 2007
Posts: 1527
PostPosted: Thu Oct 23, 2008 3:38 pm Post subject: Reply with quote
Rockets will be interesting to watch and analyze.
Risk-taking trading for Artest is one thing. Trading away McGrady or Yao would be another level. How seriously considered? How seriously do the numbers suggest it should be considered? I'd consider those things heavily from all angles. If not now, next July.
You could say McGrady and Yao were already there and are hard to get equal value for ... or you could explore trades hard anyways,mostly for McGrady. Though Yao would be easier to get value for. Would the owner and President of the Warriors have said no to Yao / Alston for Davis / Harrington (with more use of Scola) and whatever filler was needed in the deal? Always options, half-baked or better.
Rockets fate from here affected by overall chemistry and leadership at PG. Alston decent but may or may not be enough. Looking at Rockets PGs you could guess PG defense is valued highly (Alston, Jackson) or it isn't (Mcgrady Brooks Barry) or that the mix is deemed acceptable. Being a decent frequent 3 point matters fairly significantly (Alston Brooks Jackson)... but driving the lane does not (Alston Brooks Jackson Barry even McGrady much of the time) or does not fit the rest of the team design / floor reality? Above average rebounding is sought (Alston Jackson the Francis hope att the time) but above average assist-making from the PG isn't a big deal (all of them)?
What level of PG could they get for McGrady? Probably not enough... though Kidd might have been interesting (perhaps in a multi-team deal).
Rockets interior cloggers do great on defense but maybe a double-edged sword doing the same on offense some. A PF who can hit the three, pass, move, drive would seem a fairly obvious target to try to add to the roster options. And not a rookie. Artest could well be that ticket.
"On a typical scoring play, you can divvy up the credit much more precisely than we've done in the past," says Dan Rosenbaum, a part-time adviser to the Cavaliers who is also a senior economist in the White House Office of Management and Budget. "You need to account for the guy who set the pick, the guy who made the pass, the guy who set up in the corner to spread the floor, the guy who cleared space by moving down the lane—and that's just the offense."
You can let adjusted +/- find it or you can think about it directly and have a credit / blame assignment accounting table (based on regression or subjective or a combo) going beyond what I've suggested before and protrade had a version of for a brief time. Or do both and compare. Does the former look /feel more accurate to the basketball guys and less subject to the noise / error of adjusted +/- ? Why not check.
Last edited by Mountain on Thu Oct 23, 2008 5:29 pm; edited 10 times in total
Back to top
View user's profile Send private message
Ryan J. Parker
Joined: 23 Mar 2007
Posts: 711
Location: Raleigh, NC
PostPosted: Thu Oct 23, 2008 3:51 pm Post subject: Reply with quote
That's a good read, although I do have one question: Can't we consider the Celtics a successful example of analytics?
I'm sure it's hard for the mainstream to look past KG, Pierce and Allen, but I'd like to think there were some analytic components that helped them win the championship.
Clearly the Rockets are the biggest spenders, but that doesn't mean if they don't win a championship we can't consider their techniques successful in making them a better team.
_________________
I am a basketball geek.
Back to top
View user's profile Send private message Visit poster's website
gabefarkas
Joined: 31 Dec 2004
Posts: 1313
Location: Durham, NC
PostPosted: Fri Nov 07, 2008 1:33 pm Post subject: Reply with quote
I love that nickname. Numberjacks.
I'd never heard it before, but I propose we all adopt it post-haste!
Back to top
View user's profile Send private message Send e-mail AIM Address
Mountain
Joined: 13 Mar 2007
Posts: 1527
PostPosted: Fri Nov 07, 2008 2:36 pm Post subject: Reply with quote
"Hijackers" for those who take something too far from where it belonged, "Lojack"ers who guide the recovery?
In perhaps related news PGs for Rockets double their counterpart point advantage compared to last season but triple their counterpart PER deficit.
But then Rockets SGs have lost ground on scoring but made a strong move to the positive on counterpart PER. I guess I could back off some on McGrady's TS% and recognize that he is doing some things right- passing and playing 1 on 1 defense. But then I see an on/off of -35 and both team offense and team defense double digits worse with McGrady on vs off so I'll wait to see how much I should back off on the main SG the Rockets continue to go to battle with. In the bottom third on team for raw +/- and -4 on adjusted.
Brooks great on raw but worse than McGrady on adjusted. Alston far far worse.
Yao leading the way on adjusted so far, despite lowest since rookie season shots attempts and by far career worse FG%. I'd take care of him more, get him more and better shots over the shot happy guards. Artest is #2 in value and while I'd tighten his shots too at least he is offsetting his overshooting otherwise.
Yao, Scola, Landry getting about 28 shots per game so far. It was about 30 last season. I'd think it could and should be 33+ ideally.
Back to top
View user's profile Send private message
Serhat Ugur (hoopseng)
Joined: 13 Oct 2006
Posts: 208
Location: Basketball Research
PostPosted: Fri Nov 07, 2008 5:59 pm Post subject: Re: ESPN Magazine profile on Rockets GM Reply with quote
Quote:
Several teams, including the Nets (Ken Catanella), Nuggets (Dean Oliver) and Cavaliers (Dan Rosenbaum) consult a statistical analyst on personnel decisions...
Let's complete the full list! What other teams employ consultant(s)?
+ Celtics (Mike Zarren)
_________________
http://www.nbastuffer.com
Back to top
View user's profile Send private message Visit poster's website
Mountain
Joined: 13 Mar 2007
Posts: 1527
PostPosted: Fri Nov 07, 2008 6:21 pm Post subject: Reply with quote
Correct me if I am wrong:
Previously revealed
Cavs David Lewin
Rockets Ed Kupfer
Portland Jeff Ma (I think, to some degree)
Other
(I think I know who but won't say right now)
Eli Witus
David Sparks
Roland Beech (not absolutely sure which one or several)
There is more and apparently more coming.
If a team wants new ideas, collaboration to push existing projects further or tough questions aimed at maximum awareness and advancement, drop me a private message here.
Last edited by Mountain on Sat Nov 08, 2008 2:48 pm; edited 3 times in total
Back to top
View user's profile Send private message
Serhat Ugur (hoopseng)
Joined: 13 Oct 2006
Posts: 208
Location: Basketball Research
PostPosted: Fri Nov 07, 2008 7:07 pm Post subject: Reply with quote
Mountain wrote:
(I think I know but won't say)
Eli Witus
David Sparks
I remember both of them revealed their teams?
_________________
http://www.nbastuffer.com
Back to top
View user's profile Send private message Visit poster's website
Mountain
Joined: 13 Mar 2007
Posts: 1527
PostPosted: Fri Nov 07, 2008 8:46 pm Post subject: Reply with quote
I think it was revealed. I pulled back because I wasn't absolutely sure without checking further it was directly by them and I was trying to be cautious / respectful.
Back to top
View user's profile Send private message
Mountain
Joined: 13 Mar 2007
Posts: 1527
PostPosted: Sat Nov 08, 2008 1:28 am Post subject: Reply with quote
McGrady, Artest, Brooks and Alston 12-41. 29% FG%.
Yao, Scola, Landry actually get 36 shots (given McGrady's 5 shot night) and go 20-36. 56% FG%.
Rockets 28th on team eFG% going into the game.
Maybe an abnormal low but...
17th last season.
7 of top 8 playoff teams were top 15 and 6 were top 10.
Cavs bucked the pattern despite being 26th with the strong defense but this would have to be considered the leading cause of falling 2 steps short of their ultimate goal.
Shots not movable without limit of course but move a couple here and there and you could make a significant shift and meaningful impact. Major challenge to sort this out.
Landry career high field goal attempts and 2nd highest point night. Demonstrates ability to be more than a 5-7 shot guy? One game not enough but I'd try to maximize him given his efficiency. Before some others -but not these next two.
Scola had his 5th biggest scoring night 3 days ago. I think Scola and Landry have figured out to take more shots.
Of course Yao should be doing this too. Maybe he isn't ready yet.
Wonder what the coaches and management are saying and doing as this point. Of course it is early so panic is not the proper response but better to recognize things and straight it out as soon possible so bad patterns don't harden.
Last edited by Mountain on Sat Nov 08, 2008 2:47 am; edited 3 times in total
Back to top
View user's profile Send private message
John Hollinger
Joined: 14 Feb 2005
Posts: 175
PostPosted: Sat Nov 08, 2008 1:35 am Post subject: Reply with quote
Blazers are using somebody else, actually -- not sure if that's instead of Ma or in addition to.
Back to top
View user's profile Send private message AIM Address
Mountain
Joined: 13 Mar 2007
Posts: 1527
PostPosted: Sat Nov 08, 2008 2:50 am Post subject: Reply with quote
"Can't we consider the Celtics a successful example of analytics?"
I'd assume so but as you say how much impact is hard to know from the outside.
Looks like they got just about everything right by one means or another- traditional or new, straightforward or complicated.
Ainge appears to have gotten the brain typing right too as just about everyone fit their role well and formed a unified productive team. I had some doubts about several parts- Doc, Ray, Perkins- but they worked out.
Or maybe it would be more accurate to say they got some things so right (Garnett, defense) that if other things weren't that good it was harder to dwell on them.
Celtics' big 3 on usage all at about 58% TS% is nice construction. That isn't complicated to identify and seek but it takes lots of work & discipline to realize.
Other teams handled this task well too.
Orlando's shot distribution was also proper and extremely balanced & deep. Some combination of forces deserve praise.
Same for Utah.
Don't know if Mitch Kupchak has a separate analytical staff but that organization also did a very fine job with shot distribution.
Certainly coaches should get a good share of the credit.
Phoenix of course did this part well too.
This was not what held Denver back.
Other contenders weren't as strong on this.
Last edited by Mountain on Sat Nov 08, 2008 5:20 pm; edited 1 time in total
Back to top
View user's profile Send private message
iamawesomer
Joined: 01 Sep 2008
Posts: 18
PostPosted: Sat Nov 08, 2008 3:49 am Post subject: Reply with quote
Roland was with the Mavs when I spoke to him last month.
Back to top
View user's profile Send private message
Mountain
Joined: 13 Mar 2007
Posts: 1527
PostPosted: Sat Nov 08, 2008 1:33 pm Post subject: Reply with quote
Which reminds of Winston / Sagarin. Who I assume but don't know for a fact are still associated with the Mavs.
Depending on how you define this I'd think others who maintain and study databases for teams qualify.
Back to top
View user's profile Send private message
Mountain
Joined: 13 Mar 2007
Posts: 1527
PostPosted: Sat Nov 08, 2008 9:11 pm Post subject: Reply with quote
Rockets near the top on FT/FG so far this season (after being 27th last season), which offsets current eFG% weakness. Will one or both last?
Cavs were bottom 10 weak on both last season but are top 10 on both right now. Will one or both last?
Back to top
View user's profile Send private message
Re: Recovered old threads- miscellaneous topics
deepak
Joined: 26 Apr 2006
Posts: 665
PostPosted: Wed Oct 29, 2008 12:38 pm Post subject: Higher Learning with Rockets Sam Hinkie Reply with quote
I thought this was a very insightful read, particularly for the stats community, from Jason Friedman of Rockets.com:
http://www.nba.com/rockets/news/Higher_ ... 72-34.html
Hinkie discusses his approach to analyzing performance on the floor. I want to highlight this part, and get your thoughts on it:
Quote:
The game ends and the clock’s hands are creeping toward midnight. But there was still one more thing I had to know before calling it a night. After listening to Hinkie rave all evening about bench guys like Barry, Brooks, Landry and Hayes, how do the Rockets go about the process of formulating optimal lineups and player combinations for a squad which could realistically go ten-deep if it so desired?
“You’ve heard me talk a lot about using line-up analysis, or using data we might have on combinations of various players together,” explained Hinkie. “We look at those and stare at what that tells us pretty deeply. But I’ll also say that we don’t look at them blindly because sometimes a player can be in a particular lineup and look stellar, and it’s not him that’s driving the value. So you really have to tease out the difference – is it him or is it something else that’s going on?
“One of the classic cases that we often see is when a player is playing very small minutes, and playing at a very high level. Yet it’s still hard to forecast from just that alone going forward. The reason is: he was often played that way because a really well-reasoned coaching staff played him in a way that he would be most successful. So they only played him against match-ups they assumed were favorable to him. When that’s the case, to go ahead and say, ‘Oh, we’ll just take that guy and make him a starter, or triple his minutes and get the same or similar production,” is often a real fallacy and you have to think through that carefully.
“At the same time, I think it’s pretty important not to overlook what you’ve seen in the player’s past performance. So if you see something that’s tantalizing – and we often talk at length about whether it’s worth attempting a new line-up, or whether it’s worth trying these two players in combination, or whether the various psyches of the players can accept coming off the bench, or starting, or playing in a supportive role, or playing with the ball in their hands, or playing in the corner waiting for a shot versus playing pick-and-roll all the time – you have to look into it.
“So there’s no one answer there; we have tools that are useful, but at the same time we go to great lengths to balance what the data tells us with what our eyes tell us, what all of our scouting processes tell us, and what our coaching staff tells us.”
Is this just a fundamental problem with statistics for players that play a relatively small number of minutes per game, or is there a way to overcome it? To me, this seems like a real shortcoming for per-minute stats or even the +/- or adjusted +/- stats. Even if a role player is playing an entire season -- 1500 minutes -- if he's not playing much per game, how confident can we be about how his production holds up with more playing time?
For example, you could have a player who'll play so many X minutes each game as long as his team is maintaining a lead or extending it with him on the court. But the coach may be much quicker to yank him if the team starts to struggle while he's on the court. For such a player, the +/- or even per-minute stats might be deceptively high. Any way around that?
Back to top
View user's profile Send private message
Ryan J. Parker
Joined: 23 Mar 2007
Posts: 711
Location: Raleigh, NC
PostPosted: Wed Oct 29, 2008 12:55 pm Post subject: Reply with quote
Quote:
Is this just a fundamental problem with statistics for players that play a relatively small number of minutes per game, or is there a way to overcome it? To me, this seems like a real shortcoming for per-minute stats or even the +/- or adjusted +/- stats. Even if a role player is playing an entire season -- 1500 minutes -- if he's not playing much per game, how confident can we be about how his production holds up with more playing time?
I don't have an answer for this, but I'm going to explore how player's perform under varying game conditions. The more I think about it, the more it sounds like what Pro Football Prospectus does with looking at down and distance, time remaining, lead, etc.
At some point you have to figure out what performance under these conditions means with respect to "normal" conditions (such as a player that only plays when a team is up by 15 in the 2nd half), but hopefully there is some data to form this relationship.
This is just one idea I've had to try and figure this out. Anyone else have anything?
_________________
I am a basketball geek.
Back to top
View user's profile Send private message Visit poster's website
thref23
Joined: 13 Aug 2007
Posts: 90
PostPosted: Wed Oct 29, 2008 1:12 pm Post subject: Re: Higher Learning with Rockets Sam Hinkie Reply with quote
deepak_e wrote:
Is this just a fundamental problem with statistics for players that play a relatively small number of minutes per game, or is there a way to overcome it?
Adjusted plus minus attempts to overcome this somewhat, by factoring in the strength of the opponent's lineup.
Really, I feel that the statistical solution here involves extremely complex and detailed databases. There are a lot of splits currently available online, but if I am in an NBA front office and have a small budget to work with, a top priority of mine would be to work on creating and maintaining a database which would allow - at the click of a button or two - me to break player and team stats down on a detailed player, opponent, matchup, lineup, game context, and even a play type basis. This would provide an easier way to judge how a player is (or isn't) being utilized to his strengths (or an opponent's weaknesses) without having to view a lot of film upfront. (ETA, Ryan beats me to this point, somewhat)
In the meantime, I think the idea is simply to temper statistics based on minutes played per game. The challenge is choosing the ideal degree and method of temperament.
Back to top
View user's profile Send private message Send e-mail
deepak
Joined: 26 Apr 2006
Posts: 665
PostPosted: Wed Oct 29, 2008 2:27 pm Post subject: Reply with quote
I think there might also be some value in looking at how often a stint for player results in outscoring the opponent versus getting outscored. +/- takes the aggregate, but that's skewed towards the longer stints where the coach was more likely to keep the player on the court if he and the team is playing well.
Back to top
View user's profile Send private message
Mountain
Joined: 13 Mar 2007
Posts: 1527
PostPosted: Thu Oct 30, 2008 3:06 am Post subject: Reply with quote
If 500 minutes or whatever for a player's total or a split is too small to be statistically that significant then maybe aggregating player data by type would be of some value for improving "feel" by seeing trends for these types at much larger minute levels. If types or even just player "similars" are a meaningful construct or you believe they are better used than not using them. Or even just using types or similars for teammates or opponents could help.
If you have a role to fill it would make some sense to project a player's performance in that role based on a weighted set of his performance in similar circumstances to the circumstances in all their detail you care to study related to that role.
It would be hard to do accurately but still might be useful to try to grade coaches on relative lineup efficiency.
Anybody know offhand the average number of lineups in a game? I've studied season lineup usage some but looking more closely at lineup usage in a game would also be a proper of study and generate hundreds of questions. Can a coach verbalize in detail to the GM or to the stat analyst why he made the 20+ lineup changes exactly as he did as opposed to all the other options? Each time he changed and on a reasonable interval (1 minute?) each stretch he did not? How hard are coaches pressed to explain this and improve it by committee review and further research as opposed to the coach making those calls next time as he will based on his own learning?
From the outside I get the impression that coaches still do mostly what they want with lineup calls but maybe I am wrong? Are the best teams more rigorous with this process? Are the most analytical teams overall changing this process significantly yet? Have coaches successful avoided this with the exception of the occasional tweak- big and necessary or small enough not to ruffle feathers? Compared to the average coach or the best coach how much better could you do at optimizing lineups? 5% would be huge and somehow I think you could do more than that if you went at it truly openly and massively. Would be interesting to know more about the behind the scenes conversations between front office personnel and Adelman. How much advice does he accept / use and does the expertise blend well? What will the season result be and what could it have been if one or the other decision-making force had more control?
Last edited by Mountain on Thu Oct 30, 2008 11:45 pm; edited 3 times in total
Back to top
View user's profile Send private message
Mike G
Joined: 14 Jan 2005
Posts: 3628
Location: Hendersonville, NC
PostPosted: Thu Oct 30, 2008 6:03 am Post subject: Reply with quote
In baseball, there are 'platoon' players: A pair of guys shares a single job, based on whether the opposing pitcher is a leftie or a rightie. Theoretically, both guys have better hitting numbers, that don't translate to full-time duty.
It isn't because the opponent is 'weaker' in every case; it means the matchup is more favorable in every case.
Since a basketball player is playing both offense and defense about twice per minute, with a team, it's much a more complex lineup juggling. A great 1-1 defender might struggle with a pick/roll. A tall guard may post up and feast on a certain counterpart.
_________________
`
36% of all statistics are wrong
Back to top
View user's profile Send private message Send e-mail
Mountain
Joined: 13 Mar 2007
Posts: 1527
PostPosted: Sat Nov 01, 2008 4:46 pm Post subject: Reply with quote
Knowing last year's values but also knowing that FG% can vary with usage what do the Rockets expect the FG% values to be for their main guys and how well does shot distribution follow that? And how much each does management, the coach and the players determine this?
McGrady taking less, perhaps significantly less than 20 shots a game sounds like a good idea to me but does it to him? Especially if Artest is cranking em up? After 2 games it is Artest 18 a game, McGrady 14. I think I heard McGrady saying something to the effect that he is fine with sharing more of the load but will it stay that way? And is he the kind of guy whose FG% will go up with fewer shots or does he need 20 shots a game to find his hot stretches? His FG% may affect this. Maybe if he is shooting well taking less shots he gets praise and stays there... or maybe if he is shooting well he drifts back to taking more; or if he is not shooting well he rushes back to it.
Will Alston go back well below 10 shots per game? How many is Brooks going to take? How many should he? Alston isn't going to like taking less. Landry left with less than last year or does the coach actively try to get him more? Scola get his 8 or will he get less? Enough shots left for Battier or Barry?
Is 15 the right number for Yao or should it be 18+?
Looking forward to seeing what happens and guessing what they tried to make happen. Last year's crew was pretty highly team win oriented so it might work out with the Rockets taking the best shots available night to night but this season looks more challenging.
If you are the opposing coach who do you want to shoot more than normal? Plenty of choices night to night with perhaps McGrady the best frequent choice given his near bottom of the team TS% last season, if he is like last season from a FG% standpoint or worse.
Last edited by Mountain on Sat Nov 01, 2008 8:55 pm; edited 1 time in total
Back to top
View user's profile Send private message
deepak
Joined: 26 Apr 2006
Posts: 665
PostPosted: Sat Nov 01, 2008 7:18 pm Post subject: Reply with quote
From my observation, both McGrady and Alston are players that need a lot of touches and a lot of freedom to maximize their efficiency. I have noticed that the Rockets get Tracy more looks in post up situations, which could help his efficiency. This is one of those side effects of having Artest. With Battier, the other team could get away with putting their smaller wing player on him and use a stronger, perhaps more athletic wing on Tracy. Most teams are going to be very reluctant to do that with Artest, so Tracy will get more smalls on him.
Back to top
View user's profile Send private message
Mountain
Joined: 13 Mar 2007
Posts: 1527
PostPosted: Sat Nov 01, 2008 11:42 pm Post subject: Reply with quote
McGrady may indeed need a lot of touches and a lot of freedom to maximize his scoring efficiency...
but last season he had the lowest TS% of any player shooting 15+ FGAs per game in the league by a clearcut and pretty large margin and finished 3rd worst to just Jamal Tinsley and Larry Hughes for those taking 10+ shots.
And while he has a dozen and half worse than him right now for those taking 14+ shots his TS% this season so far, if it continued as is for him, while others recover to what they usually do (if they do), it would project to make the lowest TS% again this time too. Small sample right now is favoring McGrady a bit compared to last season.
Yao Ming had the 4th best of any player shooting 15+ FGAs per game and yet McGrady got almost 30% more FGAs.
What matters is overall team performance but 17th on team eFG% last season calls for improved shot management by McGrady, the PGs, Yao, the Coach and management. Plenty enough regular season wins but need better shooting / scoring efficiency to advance in playoffs.
McGrady getting fouled more so far compared to lowest last season since he was 19 but how long does that last and is it enough? Last year he took 80% of his shots as jumpers putting him in top 25 on an 82games list for that frequency.
Tighten things up on the team in other ways with the benefit of analysis, great; but give this particular superstar too much slack and you are giving it back.
Last edited by Mountain on Sun Nov 02, 2008 3:14 pm; edited 3 times in total
Back to top
View user's profile Send private message
Mountain
Joined: 13 Mar 2007
Posts: 1527
PostPosted: Sun Nov 02, 2008 1:48 am Post subject: Reply with quote
Moving 3 offensive takes from McGrady to Yao last season would have by itself been worth but 0.6 pts due to a .100 differential on TS%. Does not sound like much but about a 12% gain on team point differential.
For where they were on differential how much has that worth in regular season wins? I get impression again not much though I'd think that could still have more significant impact on seeding and playoff success probability.
But how much would 0.6 points be worth in the playoff games themselves against last season's actual or a typical strength opponent by round? Anyone readily capable and willing want to answer those questions? I get impression it could be somewhat surprising how significant this would be in terms of odds of advancement to conference finals or beyond.
Can Yao handle 18 shots as well as 15 now? Maybe, maybe not. I'd find out.
Even if he couldn't, almost every one on the Rockets did better based on average TS%, regular season and playoffs though average TS% and marginal TS% can be different and have different relationships by player and that would be a proper point of inquiry.
How much could you generate if you replaced McGrady with a league average SG on TS% for all his shots? Seems like it could be pretty big in impact too, a much smaller differential than compared to Yao but on far more shots. You could argue but he is the motor with his shot-creation value but Rockets shot better eFG% with him off than on (though free throws were up a bit with) but I don't know what it would show if you back him and his subs out. Complications due to facing starters vs subs but this could be address an answer estimated.
Of course you get all of McGrady or somebody else not just their shooting so this hypothetical is not the place to end it but back out shooting and is he above average on PER? Most Rockets better on defensive rating though McGrady does well on counterpart defense. #3 on team on win % on the court so that can't be ignored.
What would a Wins Above Average Player analysis suggest as to the impact of replacing him with a fully league average SG?
But he is probably considered "untradeable" ...
by one definition or another. (But was he in summer 2007? I'd have looked hard then and since for the right deal. http://tinyurl.com/5dw4gn)
Still doesn't mean you have to give 37 minutes against mostly starters like last year. I hear they plan to cut back but by how much? He is at 33 minutes per game right now.
Some change but if that makes sense why not more? What if you cut him to 28 and made it more against subs and told him they want him spry and causing havoc with more energy and maximum impact like Ginobili (in all but last season)? Doubt they would make him or get him to buy into it. But I'd check it hard / maybe try it if you thought you could implement fairly subtly without theatrics / major distraction.
The push for a title? Maybe this could be the kind of change that makes a significant difference. Sure stop short of it if you think you already got it covered or McGrady is going to be different from last year or even the season before but why stop short if you don't know which way is best or the early part of the season does not show him delivering well enough? Artest and a healthy Battier would seem to make this bigger change possible and the early talk was McGrady willing to share the load. Maybe you go back to normal with McGrady playing the role of the star in the playoffs fresher or maybe you go back to that in a lesser way. How much lesser makes sense maybe be hard to say and certainly will have different opinions but only get so many cracks at it. Add Artest and rerun normal McGrady role vs a significantly different one for TMac. Plenty of regular season that could be used to gather data on that choice- play 20 games each way?- and then make the decision.
Ultimately this is a simplistic representation; still comes down to the net efficiency of every lineup and the match-ups they go against and the plays called and how they are executed. Exactly how McGrady fits best to be determined- then acted on fully or not.
Last edited by Mountain on Sun Nov 02, 2008 4:57 pm; edited 2 times in total
Back to top
View user's profile Send private message
Mountain
Joined: 13 Mar 2007
Posts: 1527
PostPosted: Sun Nov 02, 2008 3:19 pm Post subject: Reply with quote
Last season was a low year for McGrady and maybe he bounces back some but this isn't picking on a guy for one off season. He has 5 of the worst 35 seasons on TS% since 1980 for players taking 20+ shots per game, a mark exceeded only by Allen iverson and only about 5 other guys have 2. And he also has 7 of the worst 51 taking more than 19.7 shots per game, escaping this group just 1 in his 8 qualifying seasons.
Back to top
View user's profile Send private message
Mountain
Joined: 13 Mar 2007
Posts: 1527
PostPosted: Mon Nov 03, 2008 7:58 pm Post subject: Reply with quote
Maybe McGrady should be viewed more as a super-sized Jason Kidd than a Kobe Bryant type wing.
He is still shoot first right now but maybe it could be moved further in the direction of distributor, something he can do well when he wants to. Or just less shooter/scorer.
Maybe that is the solution, for more than just the 4th quarter or the last 5 minutes.
Plenty of second wave defenders if/when PGs get by McGrady.
You could get battier and Artest both on the court at the wings and keep the good things the PFs are doing.
Maybe you don't do it for the full season. Maybe you do it big time just in the playoffs and see if this is difficult to handle / works net. But you probably need to test it some. Against some key match-ups maybe this is a flop. I guess I'd work up information this strategy from here since a trade of McGrady less unlikely. Pretty decent shot at playoff success all things considered.
Joined: 26 Apr 2006
Posts: 665
PostPosted: Wed Oct 29, 2008 12:38 pm Post subject: Higher Learning with Rockets Sam Hinkie Reply with quote
I thought this was a very insightful read, particularly for the stats community, from Jason Friedman of Rockets.com:
http://www.nba.com/rockets/news/Higher_ ... 72-34.html
Hinkie discusses his approach to analyzing performance on the floor. I want to highlight this part, and get your thoughts on it:
Quote:
The game ends and the clock’s hands are creeping toward midnight. But there was still one more thing I had to know before calling it a night. After listening to Hinkie rave all evening about bench guys like Barry, Brooks, Landry and Hayes, how do the Rockets go about the process of formulating optimal lineups and player combinations for a squad which could realistically go ten-deep if it so desired?
“You’ve heard me talk a lot about using line-up analysis, or using data we might have on combinations of various players together,” explained Hinkie. “We look at those and stare at what that tells us pretty deeply. But I’ll also say that we don’t look at them blindly because sometimes a player can be in a particular lineup and look stellar, and it’s not him that’s driving the value. So you really have to tease out the difference – is it him or is it something else that’s going on?
“One of the classic cases that we often see is when a player is playing very small minutes, and playing at a very high level. Yet it’s still hard to forecast from just that alone going forward. The reason is: he was often played that way because a really well-reasoned coaching staff played him in a way that he would be most successful. So they only played him against match-ups they assumed were favorable to him. When that’s the case, to go ahead and say, ‘Oh, we’ll just take that guy and make him a starter, or triple his minutes and get the same or similar production,” is often a real fallacy and you have to think through that carefully.
“At the same time, I think it’s pretty important not to overlook what you’ve seen in the player’s past performance. So if you see something that’s tantalizing – and we often talk at length about whether it’s worth attempting a new line-up, or whether it’s worth trying these two players in combination, or whether the various psyches of the players can accept coming off the bench, or starting, or playing in a supportive role, or playing with the ball in their hands, or playing in the corner waiting for a shot versus playing pick-and-roll all the time – you have to look into it.
“So there’s no one answer there; we have tools that are useful, but at the same time we go to great lengths to balance what the data tells us with what our eyes tell us, what all of our scouting processes tell us, and what our coaching staff tells us.”
Is this just a fundamental problem with statistics for players that play a relatively small number of minutes per game, or is there a way to overcome it? To me, this seems like a real shortcoming for per-minute stats or even the +/- or adjusted +/- stats. Even if a role player is playing an entire season -- 1500 minutes -- if he's not playing much per game, how confident can we be about how his production holds up with more playing time?
For example, you could have a player who'll play so many X minutes each game as long as his team is maintaining a lead or extending it with him on the court. But the coach may be much quicker to yank him if the team starts to struggle while he's on the court. For such a player, the +/- or even per-minute stats might be deceptively high. Any way around that?
Back to top
View user's profile Send private message
Ryan J. Parker
Joined: 23 Mar 2007
Posts: 711
Location: Raleigh, NC
PostPosted: Wed Oct 29, 2008 12:55 pm Post subject: Reply with quote
Quote:
Is this just a fundamental problem with statistics for players that play a relatively small number of minutes per game, or is there a way to overcome it? To me, this seems like a real shortcoming for per-minute stats or even the +/- or adjusted +/- stats. Even if a role player is playing an entire season -- 1500 minutes -- if he's not playing much per game, how confident can we be about how his production holds up with more playing time?
I don't have an answer for this, but I'm going to explore how player's perform under varying game conditions. The more I think about it, the more it sounds like what Pro Football Prospectus does with looking at down and distance, time remaining, lead, etc.
At some point you have to figure out what performance under these conditions means with respect to "normal" conditions (such as a player that only plays when a team is up by 15 in the 2nd half), but hopefully there is some data to form this relationship.
This is just one idea I've had to try and figure this out. Anyone else have anything?
_________________
I am a basketball geek.
Back to top
View user's profile Send private message Visit poster's website
thref23
Joined: 13 Aug 2007
Posts: 90
PostPosted: Wed Oct 29, 2008 1:12 pm Post subject: Re: Higher Learning with Rockets Sam Hinkie Reply with quote
deepak_e wrote:
Is this just a fundamental problem with statistics for players that play a relatively small number of minutes per game, or is there a way to overcome it?
Adjusted plus minus attempts to overcome this somewhat, by factoring in the strength of the opponent's lineup.
Really, I feel that the statistical solution here involves extremely complex and detailed databases. There are a lot of splits currently available online, but if I am in an NBA front office and have a small budget to work with, a top priority of mine would be to work on creating and maintaining a database which would allow - at the click of a button or two - me to break player and team stats down on a detailed player, opponent, matchup, lineup, game context, and even a play type basis. This would provide an easier way to judge how a player is (or isn't) being utilized to his strengths (or an opponent's weaknesses) without having to view a lot of film upfront. (ETA, Ryan beats me to this point, somewhat)
In the meantime, I think the idea is simply to temper statistics based on minutes played per game. The challenge is choosing the ideal degree and method of temperament.
Back to top
View user's profile Send private message Send e-mail
deepak
Joined: 26 Apr 2006
Posts: 665
PostPosted: Wed Oct 29, 2008 2:27 pm Post subject: Reply with quote
I think there might also be some value in looking at how often a stint for player results in outscoring the opponent versus getting outscored. +/- takes the aggregate, but that's skewed towards the longer stints where the coach was more likely to keep the player on the court if he and the team is playing well.
Back to top
View user's profile Send private message
Mountain
Joined: 13 Mar 2007
Posts: 1527
PostPosted: Thu Oct 30, 2008 3:06 am Post subject: Reply with quote
If 500 minutes or whatever for a player's total or a split is too small to be statistically that significant then maybe aggregating player data by type would be of some value for improving "feel" by seeing trends for these types at much larger minute levels. If types or even just player "similars" are a meaningful construct or you believe they are better used than not using them. Or even just using types or similars for teammates or opponents could help.
If you have a role to fill it would make some sense to project a player's performance in that role based on a weighted set of his performance in similar circumstances to the circumstances in all their detail you care to study related to that role.
It would be hard to do accurately but still might be useful to try to grade coaches on relative lineup efficiency.
Anybody know offhand the average number of lineups in a game? I've studied season lineup usage some but looking more closely at lineup usage in a game would also be a proper of study and generate hundreds of questions. Can a coach verbalize in detail to the GM or to the stat analyst why he made the 20+ lineup changes exactly as he did as opposed to all the other options? Each time he changed and on a reasonable interval (1 minute?) each stretch he did not? How hard are coaches pressed to explain this and improve it by committee review and further research as opposed to the coach making those calls next time as he will based on his own learning?
From the outside I get the impression that coaches still do mostly what they want with lineup calls but maybe I am wrong? Are the best teams more rigorous with this process? Are the most analytical teams overall changing this process significantly yet? Have coaches successful avoided this with the exception of the occasional tweak- big and necessary or small enough not to ruffle feathers? Compared to the average coach or the best coach how much better could you do at optimizing lineups? 5% would be huge and somehow I think you could do more than that if you went at it truly openly and massively. Would be interesting to know more about the behind the scenes conversations between front office personnel and Adelman. How much advice does he accept / use and does the expertise blend well? What will the season result be and what could it have been if one or the other decision-making force had more control?
Last edited by Mountain on Thu Oct 30, 2008 11:45 pm; edited 3 times in total
Back to top
View user's profile Send private message
Mike G
Joined: 14 Jan 2005
Posts: 3628
Location: Hendersonville, NC
PostPosted: Thu Oct 30, 2008 6:03 am Post subject: Reply with quote
In baseball, there are 'platoon' players: A pair of guys shares a single job, based on whether the opposing pitcher is a leftie or a rightie. Theoretically, both guys have better hitting numbers, that don't translate to full-time duty.
It isn't because the opponent is 'weaker' in every case; it means the matchup is more favorable in every case.
Since a basketball player is playing both offense and defense about twice per minute, with a team, it's much a more complex lineup juggling. A great 1-1 defender might struggle with a pick/roll. A tall guard may post up and feast on a certain counterpart.
_________________
`
36% of all statistics are wrong
Back to top
View user's profile Send private message Send e-mail
Mountain
Joined: 13 Mar 2007
Posts: 1527
PostPosted: Sat Nov 01, 2008 4:46 pm Post subject: Reply with quote
Knowing last year's values but also knowing that FG% can vary with usage what do the Rockets expect the FG% values to be for their main guys and how well does shot distribution follow that? And how much each does management, the coach and the players determine this?
McGrady taking less, perhaps significantly less than 20 shots a game sounds like a good idea to me but does it to him? Especially if Artest is cranking em up? After 2 games it is Artest 18 a game, McGrady 14. I think I heard McGrady saying something to the effect that he is fine with sharing more of the load but will it stay that way? And is he the kind of guy whose FG% will go up with fewer shots or does he need 20 shots a game to find his hot stretches? His FG% may affect this. Maybe if he is shooting well taking less shots he gets praise and stays there... or maybe if he is shooting well he drifts back to taking more; or if he is not shooting well he rushes back to it.
Will Alston go back well below 10 shots per game? How many is Brooks going to take? How many should he? Alston isn't going to like taking less. Landry left with less than last year or does the coach actively try to get him more? Scola get his 8 or will he get less? Enough shots left for Battier or Barry?
Is 15 the right number for Yao or should it be 18+?
Looking forward to seeing what happens and guessing what they tried to make happen. Last year's crew was pretty highly team win oriented so it might work out with the Rockets taking the best shots available night to night but this season looks more challenging.
If you are the opposing coach who do you want to shoot more than normal? Plenty of choices night to night with perhaps McGrady the best frequent choice given his near bottom of the team TS% last season, if he is like last season from a FG% standpoint or worse.
Last edited by Mountain on Sat Nov 01, 2008 8:55 pm; edited 1 time in total
Back to top
View user's profile Send private message
deepak
Joined: 26 Apr 2006
Posts: 665
PostPosted: Sat Nov 01, 2008 7:18 pm Post subject: Reply with quote
From my observation, both McGrady and Alston are players that need a lot of touches and a lot of freedom to maximize their efficiency. I have noticed that the Rockets get Tracy more looks in post up situations, which could help his efficiency. This is one of those side effects of having Artest. With Battier, the other team could get away with putting their smaller wing player on him and use a stronger, perhaps more athletic wing on Tracy. Most teams are going to be very reluctant to do that with Artest, so Tracy will get more smalls on him.
Back to top
View user's profile Send private message
Mountain
Joined: 13 Mar 2007
Posts: 1527
PostPosted: Sat Nov 01, 2008 11:42 pm Post subject: Reply with quote
McGrady may indeed need a lot of touches and a lot of freedom to maximize his scoring efficiency...
but last season he had the lowest TS% of any player shooting 15+ FGAs per game in the league by a clearcut and pretty large margin and finished 3rd worst to just Jamal Tinsley and Larry Hughes for those taking 10+ shots.
And while he has a dozen and half worse than him right now for those taking 14+ shots his TS% this season so far, if it continued as is for him, while others recover to what they usually do (if they do), it would project to make the lowest TS% again this time too. Small sample right now is favoring McGrady a bit compared to last season.
Yao Ming had the 4th best of any player shooting 15+ FGAs per game and yet McGrady got almost 30% more FGAs.
What matters is overall team performance but 17th on team eFG% last season calls for improved shot management by McGrady, the PGs, Yao, the Coach and management. Plenty enough regular season wins but need better shooting / scoring efficiency to advance in playoffs.
McGrady getting fouled more so far compared to lowest last season since he was 19 but how long does that last and is it enough? Last year he took 80% of his shots as jumpers putting him in top 25 on an 82games list for that frequency.
Tighten things up on the team in other ways with the benefit of analysis, great; but give this particular superstar too much slack and you are giving it back.
Last edited by Mountain on Sun Nov 02, 2008 3:14 pm; edited 3 times in total
Back to top
View user's profile Send private message
Mountain
Joined: 13 Mar 2007
Posts: 1527
PostPosted: Sun Nov 02, 2008 1:48 am Post subject: Reply with quote
Moving 3 offensive takes from McGrady to Yao last season would have by itself been worth but 0.6 pts due to a .100 differential on TS%. Does not sound like much but about a 12% gain on team point differential.
For where they were on differential how much has that worth in regular season wins? I get impression again not much though I'd think that could still have more significant impact on seeding and playoff success probability.
But how much would 0.6 points be worth in the playoff games themselves against last season's actual or a typical strength opponent by round? Anyone readily capable and willing want to answer those questions? I get impression it could be somewhat surprising how significant this would be in terms of odds of advancement to conference finals or beyond.
Can Yao handle 18 shots as well as 15 now? Maybe, maybe not. I'd find out.
Even if he couldn't, almost every one on the Rockets did better based on average TS%, regular season and playoffs though average TS% and marginal TS% can be different and have different relationships by player and that would be a proper point of inquiry.
How much could you generate if you replaced McGrady with a league average SG on TS% for all his shots? Seems like it could be pretty big in impact too, a much smaller differential than compared to Yao but on far more shots. You could argue but he is the motor with his shot-creation value but Rockets shot better eFG% with him off than on (though free throws were up a bit with) but I don't know what it would show if you back him and his subs out. Complications due to facing starters vs subs but this could be address an answer estimated.
Of course you get all of McGrady or somebody else not just their shooting so this hypothetical is not the place to end it but back out shooting and is he above average on PER? Most Rockets better on defensive rating though McGrady does well on counterpart defense. #3 on team on win % on the court so that can't be ignored.
What would a Wins Above Average Player analysis suggest as to the impact of replacing him with a fully league average SG?
But he is probably considered "untradeable" ...
by one definition or another. (But was he in summer 2007? I'd have looked hard then and since for the right deal. http://tinyurl.com/5dw4gn)
Still doesn't mean you have to give 37 minutes against mostly starters like last year. I hear they plan to cut back but by how much? He is at 33 minutes per game right now.
Some change but if that makes sense why not more? What if you cut him to 28 and made it more against subs and told him they want him spry and causing havoc with more energy and maximum impact like Ginobili (in all but last season)? Doubt they would make him or get him to buy into it. But I'd check it hard / maybe try it if you thought you could implement fairly subtly without theatrics / major distraction.
The push for a title? Maybe this could be the kind of change that makes a significant difference. Sure stop short of it if you think you already got it covered or McGrady is going to be different from last year or even the season before but why stop short if you don't know which way is best or the early part of the season does not show him delivering well enough? Artest and a healthy Battier would seem to make this bigger change possible and the early talk was McGrady willing to share the load. Maybe you go back to normal with McGrady playing the role of the star in the playoffs fresher or maybe you go back to that in a lesser way. How much lesser makes sense maybe be hard to say and certainly will have different opinions but only get so many cracks at it. Add Artest and rerun normal McGrady role vs a significantly different one for TMac. Plenty of regular season that could be used to gather data on that choice- play 20 games each way?- and then make the decision.
Ultimately this is a simplistic representation; still comes down to the net efficiency of every lineup and the match-ups they go against and the plays called and how they are executed. Exactly how McGrady fits best to be determined- then acted on fully or not.
Last edited by Mountain on Sun Nov 02, 2008 4:57 pm; edited 2 times in total
Back to top
View user's profile Send private message
Mountain
Joined: 13 Mar 2007
Posts: 1527
PostPosted: Sun Nov 02, 2008 3:19 pm Post subject: Reply with quote
Last season was a low year for McGrady and maybe he bounces back some but this isn't picking on a guy for one off season. He has 5 of the worst 35 seasons on TS% since 1980 for players taking 20+ shots per game, a mark exceeded only by Allen iverson and only about 5 other guys have 2. And he also has 7 of the worst 51 taking more than 19.7 shots per game, escaping this group just 1 in his 8 qualifying seasons.
Back to top
View user's profile Send private message
Mountain
Joined: 13 Mar 2007
Posts: 1527
PostPosted: Mon Nov 03, 2008 7:58 pm Post subject: Reply with quote
Maybe McGrady should be viewed more as a super-sized Jason Kidd than a Kobe Bryant type wing.
He is still shoot first right now but maybe it could be moved further in the direction of distributor, something he can do well when he wants to. Or just less shooter/scorer.
Maybe that is the solution, for more than just the 4th quarter or the last 5 minutes.
Plenty of second wave defenders if/when PGs get by McGrady.
You could get battier and Artest both on the court at the wings and keep the good things the PFs are doing.
Maybe you don't do it for the full season. Maybe you do it big time just in the playoffs and see if this is difficult to handle / works net. But you probably need to test it some. Against some key match-ups maybe this is a flop. I guess I'd work up information this strategy from here since a trade of McGrady less unlikely. Pretty decent shot at playoff success all things considered.
Re: Recovered old threads- miscellaneous topics
Ryan J. Parker
Joined: 23 Mar 2007
Posts: 708
Location: Raleigh, NC
PostPosted: Tue Dec 08, 2009 9:54 am Post subject: Rockets PBP Analysis Reply with quote
I hope this guy posts here, and if not, he needs to. And if he does, you should post this here!! I enjoy stuff that makes me think.
http://bbs.clutchfans.net/showthread.php?t=178352
Cool
_________________
I am a basketball geek.
Back to top
View user's profile Send private message Visit poster's website
habetw4
Joined: 12 Nov 2009
Posts: 22
Location: CT
PostPosted: Tue Dec 08, 2009 10:47 am Post subject: Reply with quote
That's exactly the stuff you'd like to see. The next step is doing the study league-wide to compare.
_________________
I'm a twitterererer: @tomhaberstroh.
Back to top
View user's profile Send private message Send e-mail Visit poster's website
deepak
Joined: 26 Apr 2006
Posts: 664
PostPosted: Tue Dec 08, 2009 1:03 pm Post subject: Re: Rockets PBP Analysis Reply with quote
Ryan J. Parker wrote:
I hope this guy posts here, and if not, he needs to. And if he does, you should post this here!! I enjoy stuff that makes me think.
http://bbs.clutchfans.net/showthread.php?t=178352
Cool
That's me. Thanks for your PBP spreadsheets. One of these days, I need to figure out how to do that for myself before you're taken by an NBA team. Smile
Back to top
View user's profile Send private message
stareagle
Joined: 19 Feb 2009
Posts: 65
PostPosted: Tue Dec 08, 2009 5:21 pm Post subject: Re: Rockets PBP Analysis Reply with quote
deepak_e wrote:
That's me.
Great stuff!
I'm glad more people are using Ryan's brilliant PBP spreadsheets. I keep downloading the Pistons games and trying to find the time to do about 30 things with them.
Back to top
View user's profile Send private message
Ryan J. Parker
Joined: 23 Mar 2007
Posts: 708
Location: Raleigh, NC
PostPosted: Wed Dec 09, 2009 7:45 am Post subject: Reply with quote
I love the way this looks.
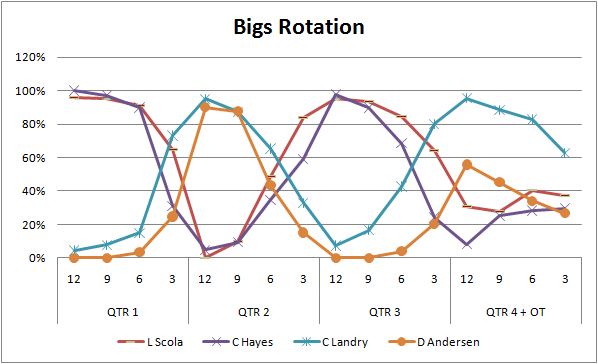
deepak
Joined: 26 Apr 2006
Posts: 664
PostPosted: Wed Dec 09, 2009 10:02 am Post subject: Reply with quote
Ryan J. Parker wrote:
I love the way this looks.
Thanks. It illustrates the percentage of minutes each player played in a given 3-minute time segment, though "rotation chart" may be a misnomer because it doesn't quite tell you which players are playing together.
Any thoughts on how that could be represented better graphically? The chart is a little cluttered as is, unfortunately.
Back to top
View user's profile Send private message
Ed Küpfer
Joined: 30 Dec 2004
Posts: 785
Location: Toronto
PostPosted: Wed Dec 09, 2009 12:02 pm Post subject: Reply with quote
Your graph does a good job of telling the story. I only have minor formatting suggestions.
* y axis should only go to 100%.
* Horizontal gridlines aren't useful because you're never going to get (or want) precise values from the graph. Graphs are for stories, tables are for precision.
* I wouldn't use points as well as lines. I think the lines do a good job of showing the patterns.
* I would group Hayes/Scola and Andersen/Landry by colour, but use two different linetypes.
* I would remove the data labels from the bottom of the graph, and attach them to the lines themselves at the rightmost point.
_________________
ed
Back to top
View user's profile Send private message Send e-mail
RChung
Joined: 28 Nov 2009
Posts: 10
PostPosted: Wed Dec 09, 2009 12:46 pm Post subject: Reply with quote
deepak_e wrote:
Thanks. It illustrates the percentage of minutes each player played in a given 3-minute time segment, though "rotation chart" may be a misnomer because it doesn't quite tell you which players are playing together.
Well, maybe it doesn't quite tell you that but it does suggest that the analytical issues are challenging. What are the raw and adjusted +/- for these guys?
Back to top
View user's profile Send private message
deepak
Joined: 26 Apr 2006
Posts: 664
PostPosted: Wed Dec 09, 2009 1:52 pm Post subject: Reply with quote
Ed Küpfer wrote:
Your graph does a good job of telling the story. I only have minor formatting suggestions.
* y axis should only go to 100%.
* Horizontal gridlines aren't useful because you're never going to get (or want) precise values from the graph. Graphs are for stories, tables are for precision.
* I wouldn't use points as well as lines. I think the lines do a good job of showing the patterns.
* I would group Hayes/Scola and Andersen/Landry by colour, but use two different linetypes.
* I would remove the data labels from the bottom of the graph, and attach them to the lines themselves at the rightmost point.
Thanks for the suggestions. For the fourth bullet, do you mean that each of the four players would have a different line type, but they would be grouped by color into starters and reserves?
RChung wrote:
deepak_e wrote:
Thanks. It illustrates the percentage of minutes each player played in a given 3-minute time segment, though "rotation chart" may be a misnomer because it doesn't quite tell you which players are playing together.
Well, maybe it doesn't quite tell you that but it does suggest that the analytical issues are challenging. What are the raw and adjusted +/- for these guys?
Scola and Hayes play the most minutes together, and according to basketballvalue Hayes has the highest adjusted +/- on the team (+24) while Scola has the lowest (-17). Raw +/- is +5.7 for Hayes, -2.6 for Scola.
Scola adjusted +/- has dropped considerably in just the last 3 games or so, however. Hayes has been rated at the top for the team pretty much the entire season.
Back to top
View user's profile Send private message
RChung
Joined: 28 Nov 2009
Posts: 10
PostPosted: Wed Dec 09, 2009 2:21 pm Post subject: Reply with quote
deepak_e wrote:
Scola and Hayes play the most minutes together, and according to basketballvalue Hayes has the highest adjusted +/- on the team (+24) while Scola has the lowest (-17). Raw +/- is +5.7 for Hayes, -2.6 for Scola.
Scola adjusted +/- has dropped considerably in just the last 3 games or so, however. Hayes has been rated at the top for the team pretty much the entire season.
Sounds consistent with the algorithm having a hard time prying apart the contributions of guys who are on the court at the same time.
Back to top
View user's profile Send private message
Ed Küpfer
Joined: 30 Dec 2004
Posts: 785
Location: Toronto
PostPosted: Wed Dec 09, 2009 2:22 pm Post subject: Reply with quote
deepak_e wrote:
For the fourth bullet, do you mean that each of the four players would have a different line type, but they would be grouped by color into starters and reserves?
I meant group the starters/reserves one way (say by colour), and group the 4s/5s a different way (say by linetype).
Also, I'm looking at the 4th quarter, where there is more of a mess. I'm wondering if a separate, more detailed look at that would be helpful.
But a really nice, clear graph nonetheless.
_________________
ed
Back to top
View user's profile Send private message Send e-mail
Crow
Joined: 20 Jan 2009
Posts: 806
PostPosted: Thu Dec 10, 2009 4:04 am Post subject: Reply with quote
Don't have Adjusted +/- Factors for the current season and the error terms would be so large right now it probably wouldn't help much but
the Adjusted Factors of Scola, Landry and Hayes from past seasons might be worth some consideration in trying to interpret results this season,
and also the raw Player Pair data
C. Hayes C. Landry 82 min + .448 per min
L. Scola C. Hayes 411 min +.063
Andersen-Landry 250 min +.099
D. Andersen C. Hayes 8 min +.121
D. Andersen L. Scola 14 min -.339
don't immediately have Scola-Landry precisely but it appears at least moderately negative and probably more in substantial use
and the overall Adjusted Pair data- if Wayne Winston or anyone else wanted to provide it
and Adjusted Pair Offensive and Defensive splits and the Factor data could be calculated too if any with Adjusted models wanted to take it to the level (Difficulty separating one payer from another? For some situations / purposes you may not have to)
though the perimeters will have their effects and players aren't the same in all interior pairs or with all perimeter matchings.
No earlier NBA data for Anderson but you could speculate from the raw and Adjusted data shows so far and maybe even look into similar detail from his European record. (I assume that was worked over pretty hard?)
You'd probably have to aggregate the lineup data to some extent to make any findings or better guesses.
It might be a useful exercise. I mean, look at it as many ways as possible and then try to integrate and see what's real or as real as you can process what's real? The image is always somewhat in the eye of the beholder and how they see or how they try to see?
Back to top
View user's profile Send private message
deepak
Joined: 26 Apr 2006
Posts: 664
PostPosted: Fri Dec 11, 2009 9:29 am Post subject: Reply with quote
Just FYI, as of yesterday I am now a contributing blogger at Red94.net, the Rockets affiliate in the TrueHoop blog network. My first entry was yesterday on Rockets stats within the first 7 seconds of their offensive possessions. Again, Ryan's PBPs were the basis for this investigation.
http://www.red94.net/?p=161
All comments/suggestions/critiques are welcome.
Back to top
View user's profile Send private message
Kevin Pelton
Site Admin
Joined: 30 Dec 2004
Posts: 978
Location: Seattle
PostPosted: Fri Dec 11, 2009 12:17 pm Post subject: Reply with quote
Good. When I saw that post on TrueHoop, I figured you'd be the right fit.
Back to top
View user's profile Send private message Send e-mail Visit poster's website
bstenger
Joined: 10 Nov 2005
Posts: 15
Location: San Francisco, CA
PostPosted: Fri Dec 11, 2009 1:47 pm Post subject: Reply with quote
I just finished an interface that makes (large) +/- graphs for sets of players on the same team. As before, it's "green/black=bad" and "orange/red=good". The interface: http://ec2-67-202-17-48.compute-1.amazonaws.com/players
Crow
Joined: 20 Jan 2009
Posts: 797
PostPosted: Fri Dec 11, 2009 3:14 pm Post subject: Reply with quote
So it looks outside the first 7 seconds Ariza is hitting for just 33% eFG%.
And despite what the overall raw numbers say strongly in favor of Landry-Hayes compared to the other interior pairings, using bstenger's charts, it looks like it has only been used in transition to other lineups or even avoided, outside of one game against OKC where it was used a ton.
Scola's Adjusted + Hayes' (despite the size of the average estimated error) isn't far off the pairs raw performance. The estimate is a bit higher than actual, some variance for strength of opponent is not a surprise, but I guess they are playing tougher lineups? The sum of their average raw +/-'s are just about right on per minute.
For Landry-Hayes the actual performance per minute is about halfway between the sum of Adjusted +/- and the sum of the player average raw +/-.
Simple addition of the Adjusted +/- for Scola and Andersen is tilting very negative and this pairing appears to have been nearly entirely avoided (properly) but it was notably poor in the few minutes tried. Looking at just player average raw +/- you wouldn't get that indicator.
Back to top
View user's profile Send private message
deepak
Joined: 26 Apr 2006
Posts: 664
PostPosted: Fri Dec 11, 2009 4:13 pm Post subject: Reply with quote
Crow wrote:
So it looks outside the first 7 seconds Ariza is hitting for just 33% eFG%.
Subtracting the stats from that post from his season totals, I've got Ariza shooting 105-307 from the field, 40-121 from 3. That comes to 34.2 FG%, 39.4 eFG%, and 43.0 TS%.
As a team, the Rockets are at 42.7 FG%, 46.3 eFG%, and 50.7 TS% outside the first 7 seconds. I could probably check some time later, but my guess is the Rockets were much more efficient than that last year. But the other factor here which I mentioned briefly towards the end is the huge improvement in offensive rebounding for the Rockets. They miss more shots in the half-court sets, but they also get more second chance opportunities.
Quote:
And despite what the overall raw numbers say strongly in favor of Landry-Hayes compared to the other interior pairings it looks like it has only been used in transition to other lineups or even avoided, outside of one game against OKC where it was used a ton.
Scola's Adjusted + Hayes' isn't far off the pairs raw performance. The estimate is a bit higher than actual, some variance for strength of opponent is not a surprise, but I guess they are playing tougher lineups? The sum of their average raw +/-'s are just about right on per minute.
The last few years the Rockets usually get off to very good starts in the 1st quarters (I haven't looked at the numbers to verify that, but I think that's been the case). It could have to do with the players on the floor, and that's what adjusted +/- assumes, but I have a suspicion there are some other factors at play. Perhaps other teams underestimate the Rockets talent level to start games, and it takes them longer to adjust.
Back to top
View user's profile Send private message
Crow
Joined: 20 Jan 2009
Posts: 797
PostPosted: Fri Dec 11, 2009 4:34 pm Post subject: Reply with quote
Perhaps I did the 3 point impact for the subset wrong in haste but below 40% eFG after the first 7 seconds is still worth noting.
Back to top
View user's profile Send private message
deepak
Joined: 26 Apr 2006
Posts: 664
PostPosted: Fri Dec 11, 2009 4:44 pm Post subject: Reply with quote
Crow wrote:
Perhaps I did the 3 point impact for the subset wrong in haste but below 40% eFG after the first 7 seconds is still worth noting.
Absolutely, and thanks for pointing that out. I made note of how good Ariza has been in transition, but the other side of that is how poor he's been otherwise.
Back to top
View user's profile Send private message
Crow
Joined: 20 Jan 2009
Posts: 797
PostPosted: Fri Dec 11, 2009 6:42 pm Post subject: Reply with quote
I should have said thanks for the correction... and of course the initial data.
He is hitting the 3 during the rest of the clock but is 35% eFG% elsewhere, including inside shots.
He has the lowest FG% from 5-10 feet (at any time) in the league this season with at least 1 attempt per game (if you roughly consider a shot at the rim within 5 feet and ignore Mike James' 1 game) and the same from 10-15 feet. 17% FG% in both cases according to hoopdata. Just barely 1 such attempt from each distance but it has its impact on the non-3 and overall FG%s.
His attempts per game from 5-15 feet are about 400% of what they were last season. He was fine from 5-10 feet then but hit only 8% FG% from 10-15 feet last season. 29% FG% from 10-15 ft in 07-8 was still bad.
Back to top
View user's profile Send private message
Crow
Joined: 20 Jan 2009
Posts: 797
PostPosted: Fri Dec 11, 2009 8:54 pm Post subject: Reply with quote
Of the 6 lineups given a positive Adjusted +/- rating at basketballvalue Hayes is in 2, Scola 2, Landry 4, Andersen 3 and Battier is in one as a PF.
Of the 7 lineups given a negative Adjusted +/- rating at basketballvalue Hayes is in 2, Scola 5, Landry 6 and Andersen 1.
9 of the 13 lineups are + or - 9 or more but I guess that isn't much given the error term. I'd think you still be actively tweaking the minutes given to the pairings to see if you could do better overall.
Back to top
View user's profile Send private message
Crow
Joined: 20 Jan 2009
Posts: 797
PostPosted: Sat Dec 12, 2009 1:07 am Post subject: Reply with quote
bstenger wrote:
I just finished an interface that makes (large) +/- graphs for sets of players on the same team. As before, it's "green/black=bad" and "orange/red=good". The interface: http://ec2-67-202-17-48.compute-1.amazonaws.com/players
Thanks.
I know your innovation is the complete presentation of the second by second progression over the course of the game but any interest in summary stats by quarter?
Or to use a similar technique on a different scale for a different stat- hypothetically you could do the game by game Adjusted +/- progression for a season. If you wanted to automate it from basketballvalue. It might be interesting to see how it rises and falls. For cause or noise.
Last edited by Crow on Sat Dec 12, 2009 4:02 pm; edited 1 time in total
Back to top
View user's profile Send private message
deepak
Joined: 26 Apr 2006
Posts: 664
PostPosted: Sat Dec 12, 2009 12:34 pm Post subject: Reply with quote
bstenger wrote:
I just finished an interface that makes (large) +/- graphs for sets of players on the same team. As before, it's "green/black=bad" and "orange/red=good". The interface: http://ec2-67-202-17-48.compute-1.amazonaws.com/players
That's very cool. Thanks.
Back to top
View user's profile Send private message
Ryan J. Parker
Joined: 23 Mar 2007
Posts: 707
Location: Raleigh, NC
PostPosted: Mon Dec 14, 2009 11:19 am Post subject: Reply with quote
It gets better: http://www.red94.net/?p=252
_________________
I am a basketball geek.
Back to top
View user's profile Send private message Visit poster's website
schtevie
Joined: 18 Apr 2005
Posts: 403
PostPosted: Mon Dec 14, 2009 12:34 pm Post subject: Reply with quote
deepak, yours is an admirable effort in trying to clarify how individual players affect game pace. However. I think your job would be made easier, and the results more informative, if you explicitly distinguished between fast breaks and half court offense.
Rather than trying to guess at what is driving (a maximal) one plus second differential on average possession length, by splitting possessions by type, you could make the relevant distinctions between fast breaks and set offenses, both in terms of pace and productivity.
Back to top
View user's profile Send private message
Ryan J. Parker
Joined: 23 Mar 2007
Posts: 707
Location: Raleigh, NC
PostPosted: Mon Dec 14, 2009 12:38 pm Post subject: Reply with quote
schtevie, I believe he tries to do this by capturing "time to first [event]". I need to re-read the article, but stuff like after a timeout is obviously not fast break. Maybe he didn't remove those? Are there other situations that he could specifically find in the play-by-play that he isn't already taking into account?
_________________
I am a basketball geek.
Back to top
View user's profile Send private message Visit poster's website
schtevie
Joined: 18 Apr 2005
Posts: 403
PostPosted: Mon Dec 14, 2009 12:54 pm Post subject: Reply with quote
Ryan, maybe I am missing something, but I am not quibbling with the "time to first event" designation. Keeping offensive rebounds out of the picture is great. What I am talking about is dividing the "time to first event" data into a fast break sample and half court sample. This is somewhat arbitrary, but we are talking about 5 seconds or 6 seconds, before and after.
Looking at the relative proportions and the average time of each, you address the two relevant pace issues directly: does a player "cause" more fast breaks and what is the effect on the average time of the half court offense.
And with this distinction you also provide the framework for what is ultimately of interest, the effect on efficiency. Is the (presumed) gain from more fast breaks offset by losses in the half court?
Back to top
View user's profile Send private message
Ryan J. Parker
Joined: 23 Mar 2007
Posts: 707
Location: Raleigh, NC
PostPosted: Mon Dec 14, 2009 1:00 pm Post subject: Reply with quote
Oh, so you're saying is he should also categorize the time to first events, and that by doing this we would know the proportion of fast break versus non fast-break events?
So Lowry might have 60% fast breaks, Brooks 55%, Battier 33%, etc?
_________________
I am a basketball geek.
Back to top
View user's profile Send private message Visit poster's website
schtevie
Joined: 18 Apr 2005
Posts: 403
PostPosted: Mon Dec 14, 2009 1:21 pm Post subject: Reply with quote
Um.....well....yeah, approximately. The fast break designation would be somewhat arbitrary, but looking at the distribution the "correct" cut off should be reasonably clear.
My prior is that what drives differences in average possession time (however defined) is fast break proportion, but maybe there are significant differences in realized first outcomes in the half court. I cannot think of any theoretical reasons why this would be so, but who knows.
Back to top
View user's profile Send private message
deepak
Joined: 26 Apr 2006
Posts: 664
PostPosted: Mon Dec 14, 2009 1:22 pm Post subject: Reply with quote
I certainly see your point, schtevie, in distinguishing the "fast break" possessions from the half-court ones.
A possession can start in several different ways:
(1) A missed shot and defensive rebound (no block shot)
(2) A blocked shot and the ball is recovered
(3) The ball is stolen
(4) Opponent turns it over and the ball is taken from out of bounds (dead ball)
(5) A forced jump ball, and team wins the tip
(6) Opponent makes FG/FT, ball taken from out of bounds
(7) The ball is recovered after an opponent score or stop, and timeout is taken (dead ball)
Does that cover all the possibilities? Its difficult to know from the play-by-play what's a "half court" possession versus a transition possession, but I could investigate further based on these different splits:
- Live Ball vs Dead Ball
- Live Ball (turnover) vs the rest
- Poss after timeout vs the rest
Any suggestions/feedback are of great help. Thanks.
Joined: 23 Mar 2007
Posts: 708
Location: Raleigh, NC
PostPosted: Tue Dec 08, 2009 9:54 am Post subject: Rockets PBP Analysis Reply with quote
I hope this guy posts here, and if not, he needs to. And if he does, you should post this here!! I enjoy stuff that makes me think.
http://bbs.clutchfans.net/showthread.php?t=178352
Cool
_________________
I am a basketball geek.
Back to top
View user's profile Send private message Visit poster's website
habetw4
Joined: 12 Nov 2009
Posts: 22
Location: CT
PostPosted: Tue Dec 08, 2009 10:47 am Post subject: Reply with quote
That's exactly the stuff you'd like to see. The next step is doing the study league-wide to compare.
_________________
I'm a twitterererer: @tomhaberstroh.
Back to top
View user's profile Send private message Send e-mail Visit poster's website
deepak
Joined: 26 Apr 2006
Posts: 664
PostPosted: Tue Dec 08, 2009 1:03 pm Post subject: Re: Rockets PBP Analysis Reply with quote
Ryan J. Parker wrote:
I hope this guy posts here, and if not, he needs to. And if he does, you should post this here!! I enjoy stuff that makes me think.
http://bbs.clutchfans.net/showthread.php?t=178352
Cool
That's me. Thanks for your PBP spreadsheets. One of these days, I need to figure out how to do that for myself before you're taken by an NBA team. Smile
Back to top
View user's profile Send private message
stareagle
Joined: 19 Feb 2009
Posts: 65
PostPosted: Tue Dec 08, 2009 5:21 pm Post subject: Re: Rockets PBP Analysis Reply with quote
deepak_e wrote:
That's me.
Great stuff!
I'm glad more people are using Ryan's brilliant PBP spreadsheets. I keep downloading the Pistons games and trying to find the time to do about 30 things with them.
Back to top
View user's profile Send private message
Ryan J. Parker
Joined: 23 Mar 2007
Posts: 708
Location: Raleigh, NC
PostPosted: Wed Dec 09, 2009 7:45 am Post subject: Reply with quote
I love the way this looks.
deepak
Joined: 26 Apr 2006
Posts: 664
PostPosted: Wed Dec 09, 2009 10:02 am Post subject: Reply with quote
Ryan J. Parker wrote:
I love the way this looks.
Thanks. It illustrates the percentage of minutes each player played in a given 3-minute time segment, though "rotation chart" may be a misnomer because it doesn't quite tell you which players are playing together.
Any thoughts on how that could be represented better graphically? The chart is a little cluttered as is, unfortunately.
Back to top
View user's profile Send private message
Ed Küpfer
Joined: 30 Dec 2004
Posts: 785
Location: Toronto
PostPosted: Wed Dec 09, 2009 12:02 pm Post subject: Reply with quote
Your graph does a good job of telling the story. I only have minor formatting suggestions.
* y axis should only go to 100%.
* Horizontal gridlines aren't useful because you're never going to get (or want) precise values from the graph. Graphs are for stories, tables are for precision.
* I wouldn't use points as well as lines. I think the lines do a good job of showing the patterns.
* I would group Hayes/Scola and Andersen/Landry by colour, but use two different linetypes.
* I would remove the data labels from the bottom of the graph, and attach them to the lines themselves at the rightmost point.
_________________
ed
Back to top
View user's profile Send private message Send e-mail
RChung
Joined: 28 Nov 2009
Posts: 10
PostPosted: Wed Dec 09, 2009 12:46 pm Post subject: Reply with quote
deepak_e wrote:
Thanks. It illustrates the percentage of minutes each player played in a given 3-minute time segment, though "rotation chart" may be a misnomer because it doesn't quite tell you which players are playing together.
Well, maybe it doesn't quite tell you that but it does suggest that the analytical issues are challenging. What are the raw and adjusted +/- for these guys?
Back to top
View user's profile Send private message
deepak
Joined: 26 Apr 2006
Posts: 664
PostPosted: Wed Dec 09, 2009 1:52 pm Post subject: Reply with quote
Ed Küpfer wrote:
Your graph does a good job of telling the story. I only have minor formatting suggestions.
* y axis should only go to 100%.
* Horizontal gridlines aren't useful because you're never going to get (or want) precise values from the graph. Graphs are for stories, tables are for precision.
* I wouldn't use points as well as lines. I think the lines do a good job of showing the patterns.
* I would group Hayes/Scola and Andersen/Landry by colour, but use two different linetypes.
* I would remove the data labels from the bottom of the graph, and attach them to the lines themselves at the rightmost point.
Thanks for the suggestions. For the fourth bullet, do you mean that each of the four players would have a different line type, but they would be grouped by color into starters and reserves?
RChung wrote:
deepak_e wrote:
Thanks. It illustrates the percentage of minutes each player played in a given 3-minute time segment, though "rotation chart" may be a misnomer because it doesn't quite tell you which players are playing together.
Well, maybe it doesn't quite tell you that but it does suggest that the analytical issues are challenging. What are the raw and adjusted +/- for these guys?
Scola and Hayes play the most minutes together, and according to basketballvalue Hayes has the highest adjusted +/- on the team (+24) while Scola has the lowest (-17). Raw +/- is +5.7 for Hayes, -2.6 for Scola.
Scola adjusted +/- has dropped considerably in just the last 3 games or so, however. Hayes has been rated at the top for the team pretty much the entire season.
Back to top
View user's profile Send private message
RChung
Joined: 28 Nov 2009
Posts: 10
PostPosted: Wed Dec 09, 2009 2:21 pm Post subject: Reply with quote
deepak_e wrote:
Scola and Hayes play the most minutes together, and according to basketballvalue Hayes has the highest adjusted +/- on the team (+24) while Scola has the lowest (-17). Raw +/- is +5.7 for Hayes, -2.6 for Scola.
Scola adjusted +/- has dropped considerably in just the last 3 games or so, however. Hayes has been rated at the top for the team pretty much the entire season.
Sounds consistent with the algorithm having a hard time prying apart the contributions of guys who are on the court at the same time.
Back to top
View user's profile Send private message
Ed Küpfer
Joined: 30 Dec 2004
Posts: 785
Location: Toronto
PostPosted: Wed Dec 09, 2009 2:22 pm Post subject: Reply with quote
deepak_e wrote:
For the fourth bullet, do you mean that each of the four players would have a different line type, but they would be grouped by color into starters and reserves?
I meant group the starters/reserves one way (say by colour), and group the 4s/5s a different way (say by linetype).
Also, I'm looking at the 4th quarter, where there is more of a mess. I'm wondering if a separate, more detailed look at that would be helpful.
But a really nice, clear graph nonetheless.
_________________
ed
Back to top
View user's profile Send private message Send e-mail
Crow
Joined: 20 Jan 2009
Posts: 806
PostPosted: Thu Dec 10, 2009 4:04 am Post subject: Reply with quote
Don't have Adjusted +/- Factors for the current season and the error terms would be so large right now it probably wouldn't help much but
the Adjusted Factors of Scola, Landry and Hayes from past seasons might be worth some consideration in trying to interpret results this season,
and also the raw Player Pair data
C. Hayes C. Landry 82 min + .448 per min
L. Scola C. Hayes 411 min +.063
Andersen-Landry 250 min +.099
D. Andersen C. Hayes 8 min +.121
D. Andersen L. Scola 14 min -.339
don't immediately have Scola-Landry precisely but it appears at least moderately negative and probably more in substantial use
and the overall Adjusted Pair data- if Wayne Winston or anyone else wanted to provide it
and Adjusted Pair Offensive and Defensive splits and the Factor data could be calculated too if any with Adjusted models wanted to take it to the level (Difficulty separating one payer from another? For some situations / purposes you may not have to)
though the perimeters will have their effects and players aren't the same in all interior pairs or with all perimeter matchings.
No earlier NBA data for Anderson but you could speculate from the raw and Adjusted data shows so far and maybe even look into similar detail from his European record. (I assume that was worked over pretty hard?)
You'd probably have to aggregate the lineup data to some extent to make any findings or better guesses.
It might be a useful exercise. I mean, look at it as many ways as possible and then try to integrate and see what's real or as real as you can process what's real? The image is always somewhat in the eye of the beholder and how they see or how they try to see?
Back to top
View user's profile Send private message
deepak
Joined: 26 Apr 2006
Posts: 664
PostPosted: Fri Dec 11, 2009 9:29 am Post subject: Reply with quote
Just FYI, as of yesterday I am now a contributing blogger at Red94.net, the Rockets affiliate in the TrueHoop blog network. My first entry was yesterday on Rockets stats within the first 7 seconds of their offensive possessions. Again, Ryan's PBPs were the basis for this investigation.
http://www.red94.net/?p=161
All comments/suggestions/critiques are welcome.
Back to top
View user's profile Send private message
Kevin Pelton
Site Admin
Joined: 30 Dec 2004
Posts: 978
Location: Seattle
PostPosted: Fri Dec 11, 2009 12:17 pm Post subject: Reply with quote
Good. When I saw that post on TrueHoop, I figured you'd be the right fit.
Back to top
View user's profile Send private message Send e-mail Visit poster's website
bstenger
Joined: 10 Nov 2005
Posts: 15
Location: San Francisco, CA
PostPosted: Fri Dec 11, 2009 1:47 pm Post subject: Reply with quote
I just finished an interface that makes (large) +/- graphs for sets of players on the same team. As before, it's "green/black=bad" and "orange/red=good". The interface: http://ec2-67-202-17-48.compute-1.amazonaws.com/players
Crow
Joined: 20 Jan 2009
Posts: 797
PostPosted: Fri Dec 11, 2009 3:14 pm Post subject: Reply with quote
So it looks outside the first 7 seconds Ariza is hitting for just 33% eFG%.
And despite what the overall raw numbers say strongly in favor of Landry-Hayes compared to the other interior pairings, using bstenger's charts, it looks like it has only been used in transition to other lineups or even avoided, outside of one game against OKC where it was used a ton.
Scola's Adjusted + Hayes' (despite the size of the average estimated error) isn't far off the pairs raw performance. The estimate is a bit higher than actual, some variance for strength of opponent is not a surprise, but I guess they are playing tougher lineups? The sum of their average raw +/-'s are just about right on per minute.
For Landry-Hayes the actual performance per minute is about halfway between the sum of Adjusted +/- and the sum of the player average raw +/-.
Simple addition of the Adjusted +/- for Scola and Andersen is tilting very negative and this pairing appears to have been nearly entirely avoided (properly) but it was notably poor in the few minutes tried. Looking at just player average raw +/- you wouldn't get that indicator.
Back to top
View user's profile Send private message
deepak
Joined: 26 Apr 2006
Posts: 664
PostPosted: Fri Dec 11, 2009 4:13 pm Post subject: Reply with quote
Crow wrote:
So it looks outside the first 7 seconds Ariza is hitting for just 33% eFG%.
Subtracting the stats from that post from his season totals, I've got Ariza shooting 105-307 from the field, 40-121 from 3. That comes to 34.2 FG%, 39.4 eFG%, and 43.0 TS%.
As a team, the Rockets are at 42.7 FG%, 46.3 eFG%, and 50.7 TS% outside the first 7 seconds. I could probably check some time later, but my guess is the Rockets were much more efficient than that last year. But the other factor here which I mentioned briefly towards the end is the huge improvement in offensive rebounding for the Rockets. They miss more shots in the half-court sets, but they also get more second chance opportunities.
Quote:
And despite what the overall raw numbers say strongly in favor of Landry-Hayes compared to the other interior pairings it looks like it has only been used in transition to other lineups or even avoided, outside of one game against OKC where it was used a ton.
Scola's Adjusted + Hayes' isn't far off the pairs raw performance. The estimate is a bit higher than actual, some variance for strength of opponent is not a surprise, but I guess they are playing tougher lineups? The sum of their average raw +/-'s are just about right on per minute.
The last few years the Rockets usually get off to very good starts in the 1st quarters (I haven't looked at the numbers to verify that, but I think that's been the case). It could have to do with the players on the floor, and that's what adjusted +/- assumes, but I have a suspicion there are some other factors at play. Perhaps other teams underestimate the Rockets talent level to start games, and it takes them longer to adjust.
Back to top
View user's profile Send private message
Crow
Joined: 20 Jan 2009
Posts: 797
PostPosted: Fri Dec 11, 2009 4:34 pm Post subject: Reply with quote
Perhaps I did the 3 point impact for the subset wrong in haste but below 40% eFG after the first 7 seconds is still worth noting.
Back to top
View user's profile Send private message
deepak
Joined: 26 Apr 2006
Posts: 664
PostPosted: Fri Dec 11, 2009 4:44 pm Post subject: Reply with quote
Crow wrote:
Perhaps I did the 3 point impact for the subset wrong in haste but below 40% eFG after the first 7 seconds is still worth noting.
Absolutely, and thanks for pointing that out. I made note of how good Ariza has been in transition, but the other side of that is how poor he's been otherwise.
Back to top
View user's profile Send private message
Crow
Joined: 20 Jan 2009
Posts: 797
PostPosted: Fri Dec 11, 2009 6:42 pm Post subject: Reply with quote
I should have said thanks for the correction... and of course the initial data.
He is hitting the 3 during the rest of the clock but is 35% eFG% elsewhere, including inside shots.
He has the lowest FG% from 5-10 feet (at any time) in the league this season with at least 1 attempt per game (if you roughly consider a shot at the rim within 5 feet and ignore Mike James' 1 game) and the same from 10-15 feet. 17% FG% in both cases according to hoopdata. Just barely 1 such attempt from each distance but it has its impact on the non-3 and overall FG%s.
His attempts per game from 5-15 feet are about 400% of what they were last season. He was fine from 5-10 feet then but hit only 8% FG% from 10-15 feet last season. 29% FG% from 10-15 ft in 07-8 was still bad.
Back to top
View user's profile Send private message
Crow
Joined: 20 Jan 2009
Posts: 797
PostPosted: Fri Dec 11, 2009 8:54 pm Post subject: Reply with quote
Of the 6 lineups given a positive Adjusted +/- rating at basketballvalue Hayes is in 2, Scola 2, Landry 4, Andersen 3 and Battier is in one as a PF.
Of the 7 lineups given a negative Adjusted +/- rating at basketballvalue Hayes is in 2, Scola 5, Landry 6 and Andersen 1.
9 of the 13 lineups are + or - 9 or more but I guess that isn't much given the error term. I'd think you still be actively tweaking the minutes given to the pairings to see if you could do better overall.
Back to top
View user's profile Send private message
Crow
Joined: 20 Jan 2009
Posts: 797
PostPosted: Sat Dec 12, 2009 1:07 am Post subject: Reply with quote
bstenger wrote:
I just finished an interface that makes (large) +/- graphs for sets of players on the same team. As before, it's "green/black=bad" and "orange/red=good". The interface: http://ec2-67-202-17-48.compute-1.amazonaws.com/players
Thanks.
I know your innovation is the complete presentation of the second by second progression over the course of the game but any interest in summary stats by quarter?
Or to use a similar technique on a different scale for a different stat- hypothetically you could do the game by game Adjusted +/- progression for a season. If you wanted to automate it from basketballvalue. It might be interesting to see how it rises and falls. For cause or noise.
Last edited by Crow on Sat Dec 12, 2009 4:02 pm; edited 1 time in total
Back to top
View user's profile Send private message
deepak
Joined: 26 Apr 2006
Posts: 664
PostPosted: Sat Dec 12, 2009 12:34 pm Post subject: Reply with quote
bstenger wrote:
I just finished an interface that makes (large) +/- graphs for sets of players on the same team. As before, it's "green/black=bad" and "orange/red=good". The interface: http://ec2-67-202-17-48.compute-1.amazonaws.com/players
That's very cool. Thanks.
Back to top
View user's profile Send private message
Ryan J. Parker
Joined: 23 Mar 2007
Posts: 707
Location: Raleigh, NC
PostPosted: Mon Dec 14, 2009 11:19 am Post subject: Reply with quote
It gets better: http://www.red94.net/?p=252
_________________
I am a basketball geek.
Back to top
View user's profile Send private message Visit poster's website
schtevie
Joined: 18 Apr 2005
Posts: 403
PostPosted: Mon Dec 14, 2009 12:34 pm Post subject: Reply with quote
deepak, yours is an admirable effort in trying to clarify how individual players affect game pace. However. I think your job would be made easier, and the results more informative, if you explicitly distinguished between fast breaks and half court offense.
Rather than trying to guess at what is driving (a maximal) one plus second differential on average possession length, by splitting possessions by type, you could make the relevant distinctions between fast breaks and set offenses, both in terms of pace and productivity.
Back to top
View user's profile Send private message
Ryan J. Parker
Joined: 23 Mar 2007
Posts: 707
Location: Raleigh, NC
PostPosted: Mon Dec 14, 2009 12:38 pm Post subject: Reply with quote
schtevie, I believe he tries to do this by capturing "time to first [event]". I need to re-read the article, but stuff like after a timeout is obviously not fast break. Maybe he didn't remove those? Are there other situations that he could specifically find in the play-by-play that he isn't already taking into account?
_________________
I am a basketball geek.
Back to top
View user's profile Send private message Visit poster's website
schtevie
Joined: 18 Apr 2005
Posts: 403
PostPosted: Mon Dec 14, 2009 12:54 pm Post subject: Reply with quote
Ryan, maybe I am missing something, but I am not quibbling with the "time to first event" designation. Keeping offensive rebounds out of the picture is great. What I am talking about is dividing the "time to first event" data into a fast break sample and half court sample. This is somewhat arbitrary, but we are talking about 5 seconds or 6 seconds, before and after.
Looking at the relative proportions and the average time of each, you address the two relevant pace issues directly: does a player "cause" more fast breaks and what is the effect on the average time of the half court offense.
And with this distinction you also provide the framework for what is ultimately of interest, the effect on efficiency. Is the (presumed) gain from more fast breaks offset by losses in the half court?
Back to top
View user's profile Send private message
Ryan J. Parker
Joined: 23 Mar 2007
Posts: 707
Location: Raleigh, NC
PostPosted: Mon Dec 14, 2009 1:00 pm Post subject: Reply with quote
Oh, so you're saying is he should also categorize the time to first events, and that by doing this we would know the proportion of fast break versus non fast-break events?
So Lowry might have 60% fast breaks, Brooks 55%, Battier 33%, etc?
_________________
I am a basketball geek.
Back to top
View user's profile Send private message Visit poster's website
schtevie
Joined: 18 Apr 2005
Posts: 403
PostPosted: Mon Dec 14, 2009 1:21 pm Post subject: Reply with quote
Um.....well....yeah, approximately. The fast break designation would be somewhat arbitrary, but looking at the distribution the "correct" cut off should be reasonably clear.
My prior is that what drives differences in average possession time (however defined) is fast break proportion, but maybe there are significant differences in realized first outcomes in the half court. I cannot think of any theoretical reasons why this would be so, but who knows.
Back to top
View user's profile Send private message
deepak
Joined: 26 Apr 2006
Posts: 664
PostPosted: Mon Dec 14, 2009 1:22 pm Post subject: Reply with quote
I certainly see your point, schtevie, in distinguishing the "fast break" possessions from the half-court ones.
A possession can start in several different ways:
(1) A missed shot and defensive rebound (no block shot)
(2) A blocked shot and the ball is recovered
(3) The ball is stolen
(4) Opponent turns it over and the ball is taken from out of bounds (dead ball)
(5) A forced jump ball, and team wins the tip
(6) Opponent makes FG/FT, ball taken from out of bounds
(7) The ball is recovered after an opponent score or stop, and timeout is taken (dead ball)
Does that cover all the possibilities? Its difficult to know from the play-by-play what's a "half court" possession versus a transition possession, but I could investigate further based on these different splits:
- Live Ball vs Dead Ball
- Live Ball (turnover) vs the rest
- Poss after timeout vs the rest
Any suggestions/feedback are of great help. Thanks.
Re: Recovered old threads- miscellaneous topics
schtevie
Joined: 18 Apr 2005
Posts: 411
PostPosted: Mon Dec 14, 2009 1:52 pm Post subject: Reply with quote
deepak, I don't think you want to overdetermine things. To the contrary, you want to simplify (at least at this stage). If it is not too much of a chore, I would look at the overall distribution of first outcomes as a function of time and pick a threshold under which the assumption is a "fast break".
Clearly, one would expect far fewer "fast breaks" to occur after dead balls, but some are still possible. I think a useful (and true) definition of a "fast break" is a possession where a scoring opportunity is realized prior to the defense being set. Beating the opponents down the court after a turnover or quick outlet on a defensive rebound is one way. But so is a quick inbound after a timeout, when a defender has his back turned. The half court then is the residual.
I don't think that any time you pick will be terribly controversial, and you could always do some sensitivity analysis.
Back to top
View user's profile Send private message
Chronz1
Joined: 22 May 2006
Posts: 201
PostPosted: Mon Dec 14, 2009 1:52 pm Post subject: Reply with quote
Wow Durvasa you gotta tell me how you made it into true hoops network, Ive been following your internet career a long time, this is basically making it to the pros by my standards. Congrats are in order friend
Back to top
View user's profile Send private message
deepak
Joined: 26 Apr 2006
Posts: 665
PostPosted: Mon Dec 14, 2009 2:06 pm Post subject: Reply with quote
Chronz1 wrote:
Wow Durvasa you gotta tell me how you made it into true hoops network, Ive been following your internet career a long time, this is basically making it to the pros by my standards. Congrats are in order friend
Thanks, but if I have an "internet career" I think I've really spent too much time on message boards. Laughing
Getting on True Hoop wasn't my doing. Rahat, who started Red94, wrote some fantastic pieces in the early going and he got the gig. I joined subsequently.
Edit:
And thanks, schtevie, for the feedback. I appreciate it.
Back to top
View user's profile Send private message
Ryan J. Parker
Joined: 23 Mar 2007
Posts: 711
Location: Raleigh, NC
PostPosted: Mon Dec 14, 2009 2:49 pm Post subject: Reply with quote
Just curious, but why would we want to define a fast break opportunity on an inbounds play? The defense should be "set" in this case, even though bodies are clearly going to be moving around and backs just might be turned.
_________________
I am a basketball geek.
Back to top
View user's profile Send private message Visit poster's website
schtevie
Joined: 18 Apr 2005
Posts: 411
PostPosted: Mon Dec 14, 2009 4:37 pm Post subject: Reply with quote
In the instance (instances?) I don't think that making a distinction will really prove to matter much. Fast breaks occur after made baskets, and these are inbounds plays. But these are not as common as after open court turnovers, where it is easier to beat the defense down the court. The dead ball situation can be viewed as the ultimate extension.
One can slice and dice "fast breakedness" in many ways, but to deal with the basic issue of how individuals influence game pace (and productivity) the simplest definition is apt to suffice.
Back to top
View user's profile Send private message
deepak
Joined: 26 Apr 2006
Posts: 665
PostPosted: Mon Dec 21, 2009 4:29 pm Post subject: Reply with quote
In my latest post, I show possession duration / efficiency curves for the Rockets, compared to the league average and also compared to what they did a year ago. The plots also include possessions for various types of "triggers" (e.g., off of a steal, defensive rebound, made field goal). Again, all stats extracted from Ryan's PBP data.
I do think these type of plots can expand on our understanding of how teams benefit from up-tempo play, and also when they're looking to run. What I have not yet included (but plan to soon) is the same plots based on time to first shot, drawn foul, turnover. As the Rockets are a pretty good offensive rebounding team, just basing it off of possession duration undersells how frequently they're looking to run. Also I want to look at how the curves changes with different player combinations.
http://www.red94.net/?p=305
As always, all comments/feedback are appreciated.
Back to top
View user's profile Send private message
schtevie
Joined: 18 Apr 2005
Posts: 411
PostPosted: Tue Dec 22, 2009 9:24 am Post subject: Reply with quote
deepak, really first rate stuff. One question about the presentation of the data and then a comment about the results.
It seems you are showing cummulative possessions on the x-axis. Any particular reason? 82games in its "shot clock usage" table shows the marginals. This seems clearer. Another graph perhaps?
Regarding the results, there is one extremely interesting phenomenon (assuming I am interpreting things correctly) that screams from the screen, and I must say that it caught me by surprise. This is the shape of the plot of the offensive efficiency for Houston and the League after made field goals (and for Houston alone after defensive rebounds). I would like to nominate this for the New Stylized Fact of the Year Award.
Basically, the results as shown shouldn't, or more precisely, needn't be. There appears to be an ample, free lunch for the taking.
What the rising portion of the curve shows is that teams are doing worse offensively than if they were to show a little more patience. This either means that they are taking bad shots or making bad passes or otherwise turning the ball over. (I suppose that it could also mean, given that the measure is offensive efficiency, that misses disproportionately become defensive rebounds early in the shot clock, which if true would also be highly interesting.)
By the top graph, roughly 20% of Houston's possessions after made fgs occur by "<15" and about one third of Houston's possessions after drs occur by "<10" (at which time the graphs assume the "expected" downward slope). It would be slick to calculate the counterfactual, of how many points on average are foregone by Houston (and the league in the case of after fg only) as a consequence of such mistakes early in the shot clock.
Again, very nice work with the data!
Back to top
View user's profile Send private message
deepak
Joined: 26 Apr 2006
Posts: 665
PostPosted: Tue Dec 22, 2009 11:05 am Post subject: Reply with quote
schtevie wrote:
deepak, really first rate stuff. One question about the presentation of the data and then a comment about the results.
It seems you are showing cummulative possessions on the x-axis. Any particular reason? 82games in its "shot clock usage" table shows the marginals. This seems clearer. Another graph perhaps?
I think my reason for presenting it that way was because, visually, it was easier to process because the lines were smooth curves (they all converge to overall efficiency). But you're right that this presentation makes it very difficult to compare efficiency, for instance, from 10-15 seconds and 15-20 seconds. I'll see what I can do about that. Instead of lines, it might need to be bar charts.
Back to top
View user's profile Send private message
deepak
Joined: 26 Apr 2006
Posts: 665
PostPosted: Wed Dec 23, 2009 3:10 am Post subject: Reply with quote
Here are some new charts where I don't look at it cumulatively. Hopefully this conveys the information more clearly. Instead of possession time, I'm using time to first shot/shooting foul/turnover. The four charts are:
* All offensive possessions
* Possessions after steals
* Possessions after made field goals
* Possessions after defensive rebound of missed field goal (didn't go out of bounds)
Note that in some cases the sample only includes a small handful of possessions (especially for the Rockets where %Poss is very low). Take the corresponding ORTG with a grain of salt.

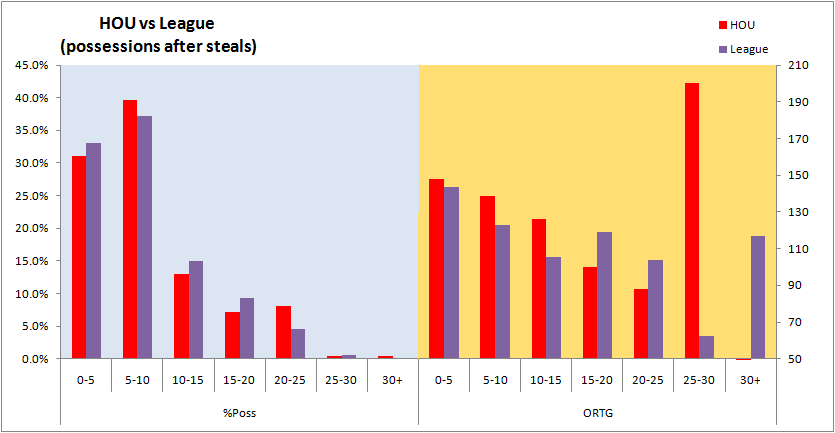
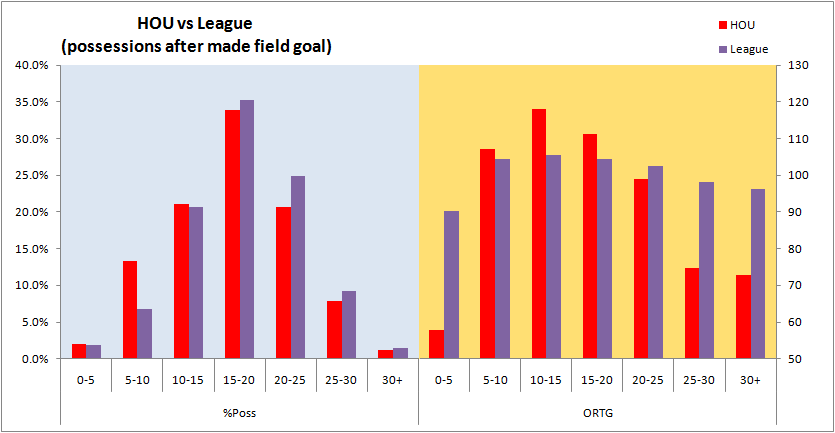


And, here is a summary:
Back to top
View user's profile Send private message
Ryan J. Parker
Joined: 23 Mar 2007
Posts: 711
Location: Raleigh, NC
PostPosted: Wed Dec 23, 2009 10:32 am Post subject: Reply with quote
These are awesome, and they remind me that I need to do more graphical analysis of data as the first step of an analysis.
_________________
I am a basketball geek.
Back to top
View user's profile Send private message Visit poster's website
schtevie
Joined: 18 Apr 2005
Posts: 411
PostPosted: Wed Dec 23, 2009 1:03 pm Post subject: Reply with quote
deepak, more excellent stuff! I still don't quite understand the time dimension. How can the definition be "first shot/shooting foul/turnover" if time goes beyond the shot clock length?
This aside, let me elaborate on my previous comments. Some of these graphs are more startling than Ed's beard. First a little theory, or, more precisely, the consequence of theorizing: Given the generally observed propensities to score, rebound, and turn the ball over in NBA basketball, it is absolutely, necessarily, without any doubt the case that in expectation, for each and every possession origin, that observed offensive efficiency (ORTG) should be monotonically decreasing as a function of elapsed possession time. I think I will call this "schtevie's law".
That this result doesn't obtain for the league on average, for possessions originating after a made field goal is startling, as it is extremely strong evidence of sub-optimal norms that are deeply entrenched in the NBA. (I note that this year's ongoing results duplicate last year's summary.)
More startling still, and here I am angling for a Dork Elvis merit badge, is the fact that Houston is a negative outlier in this regard. Very strange and apparently very costly.
By virtue of rushing the offense after opponents' made shots and also after defensive rebounds, by my estimate of deepak's bars, the consequence is not small. If my math is correct, there are 0.9 points of ORTG foregone on account of the former and 2.4 on account of the latter, for a counterfactual loss of 3.3 points foregone per 100 possessions.
deepak, if you should have the time and interest, it would be very illuminating to see these same graphs for every team in the NBA. Thanks for the great work.
Back to top
View user's profile Send private message
deepak
Joined: 26 Apr 2006
Posts: 665
PostPosted: Wed Dec 23, 2009 1:54 pm Post subject: Reply with quote
schtevie wrote:
deepak, more excellent stuff! I still don't quite understand the time dimension. How can the definition be "first shot/shooting foul/turnover" if time goes beyond the shot clock length?
That seemed strange to me at well at first, but when I took a look at the particular possessions in question it made sense. I'm tracking to first shot, drawn shooting foul, or (effectively) end-of-possession (whichever comes first). That's what I refer to, for lack of a better term, as "poss_first_time".
There are a couple ways in which this could actually last longer than 24 seconds. The first is straightforward -- there is a foul or violation that causes a shot clock reset. The trickier one is that after a made field goal (or a jump ball to start regulation/overtimes), there is no way to delineate the actual start of the ensuing possession, and the game clock doesn't stop. Sometimes, between the time the field goal make was recorded (signaling the "start" of the next possession, by my method) and when the first shot is taken on the next possession, even 30+ seconds can elapse with the shot clock still under 24 seconds. This is, unfortuntaely, a limitation in the play-by-play data. No shot clock info is given; I can only go by the game clock timestamp on recorded events.
Quote:
This aside, let me elaborate on my previous comments. Some of these graphs are more startling than Ed's beard. First a little theory, or, more precisely, the consequence of theorizing: Given the generally observed propensities to score, rebound, and turn the ball over in NBA basketball, it is absolutely, necessarily, without any doubt the case that in expectation, for each and every possession origin, that observed offensive efficiency (ORTG) should be monotonically decreasing as a function of elapsed possession time. I think I will call this "schtevie's law".
That this result doesn't obtain for the league on average, for possessions originating after a made field goal is startling, as it is extremely strong evidence of sub-optimal norms that are deeply entrenched in the NBA. (I note that this year's ongoing results duplicate last year's summary.)
Other than the first 0-5 seconds, the ORTG for the league does look to be decreasing monotonically, as per schtevie's law. Smile
And I think the low ORTG for possessions that last under 5 seconds can be explained by end-of-quarter possessions, or disproportionate number of turnovers. Its difficult for a team to get a quality shot in under 5 seconds after a made FG. So I think your law is safe. I just need to filter out end-of-quarter possessions, and perhaps discard turnover-ending possessions.
Quote:
deepak, if you should have the time and interest, it would be very illuminating to see these same graphs for every team in the NBA. Thanks for the great work.
I certainly have the interest -- time would be an issue as, at the moment, the graphs aren't being auto-generated. And that would be a lot of graphs. Smile
Back to top
View user's profile Send private message
schtevie
Joined: 18 Apr 2005
Posts: 411
PostPosted: Wed Dec 23, 2009 2:26 pm Post subject: Reply with quote
deepak, thanks for the clarifications.
It will be interesting to see how culling out the last plays of the quarters affects the results. Perhaps this will completely "clean up" the "possession after made field goal" anomaly, but my guess is that the uptick will remain. There is no particular reason to believe that end of quarter plays disproportionately occur after made field goals (not that you are saying they are). Edit/post script: And culling out the end of quarter plays that take slightly longer should correspondingly raise their ORTGs as well.
And as for turnovers, why would you want to discard these? These are an essential piece of the picture. If anything, one should (?) expect that turnovers are less likely after made field goals. My prior is that dynamic on court action is more conducive to turnovers than taking the ball out of bounds, making a safe pass to the player taking the ball up court, while the defense drifts back and sets up. What you surely don't want to discard are turnovers that are the result of teams trying to push the pace after taking the ball out of bounds.
Back to top
View user's profile Send private message
deepak
Joined: 26 Apr 2006
Posts: 665
PostPosted: Wed Dec 23, 2009 3:13 pm Post subject: Reply with quote
schtevie wrote:
deepak, thanks for the clarifications.
It will be interesting to see how culling out the last plays of the quarters affects the results. Perhaps this will completely "clean up" the "possession after made field goal" anomaly, but my guess is that the uptick will remain. There is no particular reason to believe that end of quarter plays disproportionately occur after made field goals (not that you are saying they are). Edit/post script: And culling out the end of quarter plays that take slightly longer should correspondingly raise their ORTGs as well.
A closer look at the numbers. In the second graph, I filtered out possessions in last 10 seconds and also possessions after timeouts. As you suspected, it did not make a significant difference:
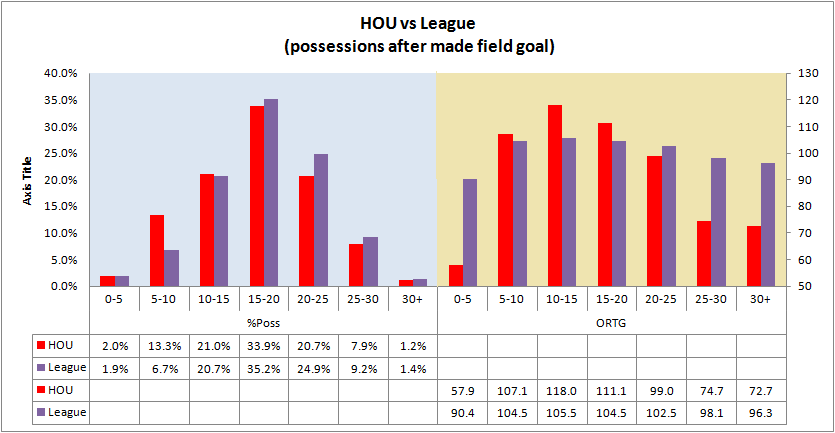

schtevie wrote:
And as for turnovers, why would you want to discard these? These are an essential piece of the picture. If anything, one should (?) expect that turnovers are less likely after made field goals. My prior is that dynamic on court action is more conducive to turnovers than taking the ball out of bounds, making a safe pass to the player taking the ball up court, while the defense drifts back and sets up. What you surely don't want to discard are turnovers that are the result of teams trying to push the pace after taking the ball out of bounds.
When I also discard turnover possessions ...

What I suspected was happening was that there was a disproportionate number of turnovers for shorter possessions than longer possessions. Why? Because a team is less likely to get a shot off after a made field goal with in the first 10 seconds. So if poss_first_time is within 10 seconds, that means a relatively larger fraction of them were due to turnovers.
So, my thinking is that this last chart is a better indicator of the quality of shots a team is able to generate as a function of poss_first_time.
Edit: Just checked the TOV% for HOU and the League as a function of poss_first_time, after made field goal (again, excluding timeouts and last 10 seconds of period). My conjecture was correct:

Back to top
View user's profile Send private message
schtevie
Joined: 18 Apr 2005
Posts: 411
PostPosted: Wed Dec 23, 2009 4:57 pm Post subject: Reply with quote
Wow, this is really great. New data, generated in real time! And they are interestinger and interestinger.
Taking tranche one, I note the robustness of the result: the alleged sub-optimality of NBA-average (and Houston) "post mfg" offense. And though I understand and agree with the argument that one should cull out possessions beginning within ten seconds of period's end, I do not with regards to post time-out possessions. For these purposes, lumping all out of bounds plays together seems most reasonable.
And by the way, in that regard, where in the data is the offense occurring after a made final free throw? Is it there at all? These too should be in the "ball taken out of bounds" mix, no?
And now for a mea culpa. In trying to estimate the effect of Houston's hurried post-mfg offense, I made not one but two errors (one transcription and one math). Dang. The long and the short of it is that imprudent action after made field goals (10 seconds left in the quarter and time out inclusive) costs Houston not 0.90 but 2.12 points per 100 possessions. Conversely, hurried post-dr offense has cost Houston only 1.19 points per 100 possessions (not 2.4). The total being 3.31 (essentially the same total as with the math errors). I should also say that these numbers are biased high, in that some of the Houston opponent made field goals were and-ones and not direct Houston scoring opportunities (but then again, if the post-final opponent free throw results are similar to post-made fg results, these estimates are biased low.....make sense?)
And from this (now corrected) base, I note that culling out the end of quarter and post-time out data would have the effect of reducing the foregone 2.12 points per 100 possessions to something less than 1.73. (To make the correct adjustment, I would need to know, on average, how many post-time-out, end of quarter post made-mfg possessions there are in a game). Regardless, the loss in efficiency on account of hurried offense, post-mfg, is non-trivial.
Moving on then to the second tranche, where, in addition, all turnovers are culled from the post-mfg sample, I was prepared to offer a "Aside from that, Mrs. Lincoln, how did you enjoy the show?" type comment (as turnovers are an integral part of the offensive calculation and not something that can be eliminated a priori) but lo and behold, the sub-optimality remains! It isn't just the extra turnovers that came about in rushing shots that drive the result, it seems it is the low quality of rushed shots as well!
Joined: 18 Apr 2005
Posts: 411
PostPosted: Mon Dec 14, 2009 1:52 pm Post subject: Reply with quote
deepak, I don't think you want to overdetermine things. To the contrary, you want to simplify (at least at this stage). If it is not too much of a chore, I would look at the overall distribution of first outcomes as a function of time and pick a threshold under which the assumption is a "fast break".
Clearly, one would expect far fewer "fast breaks" to occur after dead balls, but some are still possible. I think a useful (and true) definition of a "fast break" is a possession where a scoring opportunity is realized prior to the defense being set. Beating the opponents down the court after a turnover or quick outlet on a defensive rebound is one way. But so is a quick inbound after a timeout, when a defender has his back turned. The half court then is the residual.
I don't think that any time you pick will be terribly controversial, and you could always do some sensitivity analysis.
Back to top
View user's profile Send private message
Chronz1
Joined: 22 May 2006
Posts: 201
PostPosted: Mon Dec 14, 2009 1:52 pm Post subject: Reply with quote
Wow Durvasa you gotta tell me how you made it into true hoops network, Ive been following your internet career a long time, this is basically making it to the pros by my standards. Congrats are in order friend
Back to top
View user's profile Send private message
deepak
Joined: 26 Apr 2006
Posts: 665
PostPosted: Mon Dec 14, 2009 2:06 pm Post subject: Reply with quote
Chronz1 wrote:
Wow Durvasa you gotta tell me how you made it into true hoops network, Ive been following your internet career a long time, this is basically making it to the pros by my standards. Congrats are in order friend
Thanks, but if I have an "internet career" I think I've really spent too much time on message boards. Laughing
Getting on True Hoop wasn't my doing. Rahat, who started Red94, wrote some fantastic pieces in the early going and he got the gig. I joined subsequently.
Edit:
And thanks, schtevie, for the feedback. I appreciate it.
Back to top
View user's profile Send private message
Ryan J. Parker
Joined: 23 Mar 2007
Posts: 711
Location: Raleigh, NC
PostPosted: Mon Dec 14, 2009 2:49 pm Post subject: Reply with quote
Just curious, but why would we want to define a fast break opportunity on an inbounds play? The defense should be "set" in this case, even though bodies are clearly going to be moving around and backs just might be turned.
_________________
I am a basketball geek.
Back to top
View user's profile Send private message Visit poster's website
schtevie
Joined: 18 Apr 2005
Posts: 411
PostPosted: Mon Dec 14, 2009 4:37 pm Post subject: Reply with quote
In the instance (instances?) I don't think that making a distinction will really prove to matter much. Fast breaks occur after made baskets, and these are inbounds plays. But these are not as common as after open court turnovers, where it is easier to beat the defense down the court. The dead ball situation can be viewed as the ultimate extension.
One can slice and dice "fast breakedness" in many ways, but to deal with the basic issue of how individuals influence game pace (and productivity) the simplest definition is apt to suffice.
Back to top
View user's profile Send private message
deepak
Joined: 26 Apr 2006
Posts: 665
PostPosted: Mon Dec 21, 2009 4:29 pm Post subject: Reply with quote
In my latest post, I show possession duration / efficiency curves for the Rockets, compared to the league average and also compared to what they did a year ago. The plots also include possessions for various types of "triggers" (e.g., off of a steal, defensive rebound, made field goal). Again, all stats extracted from Ryan's PBP data.
I do think these type of plots can expand on our understanding of how teams benefit from up-tempo play, and also when they're looking to run. What I have not yet included (but plan to soon) is the same plots based on time to first shot, drawn foul, turnover. As the Rockets are a pretty good offensive rebounding team, just basing it off of possession duration undersells how frequently they're looking to run. Also I want to look at how the curves changes with different player combinations.
http://www.red94.net/?p=305
As always, all comments/feedback are appreciated.
Back to top
View user's profile Send private message
schtevie
Joined: 18 Apr 2005
Posts: 411
PostPosted: Tue Dec 22, 2009 9:24 am Post subject: Reply with quote
deepak, really first rate stuff. One question about the presentation of the data and then a comment about the results.
It seems you are showing cummulative possessions on the x-axis. Any particular reason? 82games in its "shot clock usage" table shows the marginals. This seems clearer. Another graph perhaps?
Regarding the results, there is one extremely interesting phenomenon (assuming I am interpreting things correctly) that screams from the screen, and I must say that it caught me by surprise. This is the shape of the plot of the offensive efficiency for Houston and the League after made field goals (and for Houston alone after defensive rebounds). I would like to nominate this for the New Stylized Fact of the Year Award.
Basically, the results as shown shouldn't, or more precisely, needn't be. There appears to be an ample, free lunch for the taking.
What the rising portion of the curve shows is that teams are doing worse offensively than if they were to show a little more patience. This either means that they are taking bad shots or making bad passes or otherwise turning the ball over. (I suppose that it could also mean, given that the measure is offensive efficiency, that misses disproportionately become defensive rebounds early in the shot clock, which if true would also be highly interesting.)
By the top graph, roughly 20% of Houston's possessions after made fgs occur by "<15" and about one third of Houston's possessions after drs occur by "<10" (at which time the graphs assume the "expected" downward slope). It would be slick to calculate the counterfactual, of how many points on average are foregone by Houston (and the league in the case of after fg only) as a consequence of such mistakes early in the shot clock.
Again, very nice work with the data!
Back to top
View user's profile Send private message
deepak
Joined: 26 Apr 2006
Posts: 665
PostPosted: Tue Dec 22, 2009 11:05 am Post subject: Reply with quote
schtevie wrote:
deepak, really first rate stuff. One question about the presentation of the data and then a comment about the results.
It seems you are showing cummulative possessions on the x-axis. Any particular reason? 82games in its "shot clock usage" table shows the marginals. This seems clearer. Another graph perhaps?
I think my reason for presenting it that way was because, visually, it was easier to process because the lines were smooth curves (they all converge to overall efficiency). But you're right that this presentation makes it very difficult to compare efficiency, for instance, from 10-15 seconds and 15-20 seconds. I'll see what I can do about that. Instead of lines, it might need to be bar charts.
Back to top
View user's profile Send private message
deepak
Joined: 26 Apr 2006
Posts: 665
PostPosted: Wed Dec 23, 2009 3:10 am Post subject: Reply with quote
Here are some new charts where I don't look at it cumulatively. Hopefully this conveys the information more clearly. Instead of possession time, I'm using time to first shot/shooting foul/turnover. The four charts are:
* All offensive possessions
* Possessions after steals
* Possessions after made field goals
* Possessions after defensive rebound of missed field goal (didn't go out of bounds)
Note that in some cases the sample only includes a small handful of possessions (especially for the Rockets where %Poss is very low). Take the corresponding ORTG with a grain of salt.
And, here is a summary:
Back to top
View user's profile Send private message
Ryan J. Parker
Joined: 23 Mar 2007
Posts: 711
Location: Raleigh, NC
PostPosted: Wed Dec 23, 2009 10:32 am Post subject: Reply with quote
These are awesome, and they remind me that I need to do more graphical analysis of data as the first step of an analysis.
_________________
I am a basketball geek.
Back to top
View user's profile Send private message Visit poster's website
schtevie
Joined: 18 Apr 2005
Posts: 411
PostPosted: Wed Dec 23, 2009 1:03 pm Post subject: Reply with quote
deepak, more excellent stuff! I still don't quite understand the time dimension. How can the definition be "first shot/shooting foul/turnover" if time goes beyond the shot clock length?
This aside, let me elaborate on my previous comments. Some of these graphs are more startling than Ed's beard. First a little theory, or, more precisely, the consequence of theorizing: Given the generally observed propensities to score, rebound, and turn the ball over in NBA basketball, it is absolutely, necessarily, without any doubt the case that in expectation, for each and every possession origin, that observed offensive efficiency (ORTG) should be monotonically decreasing as a function of elapsed possession time. I think I will call this "schtevie's law".
That this result doesn't obtain for the league on average, for possessions originating after a made field goal is startling, as it is extremely strong evidence of sub-optimal norms that are deeply entrenched in the NBA. (I note that this year's ongoing results duplicate last year's summary.)
More startling still, and here I am angling for a Dork Elvis merit badge, is the fact that Houston is a negative outlier in this regard. Very strange and apparently very costly.
By virtue of rushing the offense after opponents' made shots and also after defensive rebounds, by my estimate of deepak's bars, the consequence is not small. If my math is correct, there are 0.9 points of ORTG foregone on account of the former and 2.4 on account of the latter, for a counterfactual loss of 3.3 points foregone per 100 possessions.
deepak, if you should have the time and interest, it would be very illuminating to see these same graphs for every team in the NBA. Thanks for the great work.
Back to top
View user's profile Send private message
deepak
Joined: 26 Apr 2006
Posts: 665
PostPosted: Wed Dec 23, 2009 1:54 pm Post subject: Reply with quote
schtevie wrote:
deepak, more excellent stuff! I still don't quite understand the time dimension. How can the definition be "first shot/shooting foul/turnover" if time goes beyond the shot clock length?
That seemed strange to me at well at first, but when I took a look at the particular possessions in question it made sense. I'm tracking to first shot, drawn shooting foul, or (effectively) end-of-possession (whichever comes first). That's what I refer to, for lack of a better term, as "poss_first_time".
There are a couple ways in which this could actually last longer than 24 seconds. The first is straightforward -- there is a foul or violation that causes a shot clock reset. The trickier one is that after a made field goal (or a jump ball to start regulation/overtimes), there is no way to delineate the actual start of the ensuing possession, and the game clock doesn't stop. Sometimes, between the time the field goal make was recorded (signaling the "start" of the next possession, by my method) and when the first shot is taken on the next possession, even 30+ seconds can elapse with the shot clock still under 24 seconds. This is, unfortuntaely, a limitation in the play-by-play data. No shot clock info is given; I can only go by the game clock timestamp on recorded events.
Quote:
This aside, let me elaborate on my previous comments. Some of these graphs are more startling than Ed's beard. First a little theory, or, more precisely, the consequence of theorizing: Given the generally observed propensities to score, rebound, and turn the ball over in NBA basketball, it is absolutely, necessarily, without any doubt the case that in expectation, for each and every possession origin, that observed offensive efficiency (ORTG) should be monotonically decreasing as a function of elapsed possession time. I think I will call this "schtevie's law".
That this result doesn't obtain for the league on average, for possessions originating after a made field goal is startling, as it is extremely strong evidence of sub-optimal norms that are deeply entrenched in the NBA. (I note that this year's ongoing results duplicate last year's summary.)
Other than the first 0-5 seconds, the ORTG for the league does look to be decreasing monotonically, as per schtevie's law. Smile
And I think the low ORTG for possessions that last under 5 seconds can be explained by end-of-quarter possessions, or disproportionate number of turnovers. Its difficult for a team to get a quality shot in under 5 seconds after a made FG. So I think your law is safe. I just need to filter out end-of-quarter possessions, and perhaps discard turnover-ending possessions.
Quote:
deepak, if you should have the time and interest, it would be very illuminating to see these same graphs for every team in the NBA. Thanks for the great work.
I certainly have the interest -- time would be an issue as, at the moment, the graphs aren't being auto-generated. And that would be a lot of graphs. Smile
Back to top
View user's profile Send private message
schtevie
Joined: 18 Apr 2005
Posts: 411
PostPosted: Wed Dec 23, 2009 2:26 pm Post subject: Reply with quote
deepak, thanks for the clarifications.
It will be interesting to see how culling out the last plays of the quarters affects the results. Perhaps this will completely "clean up" the "possession after made field goal" anomaly, but my guess is that the uptick will remain. There is no particular reason to believe that end of quarter plays disproportionately occur after made field goals (not that you are saying they are). Edit/post script: And culling out the end of quarter plays that take slightly longer should correspondingly raise their ORTGs as well.
And as for turnovers, why would you want to discard these? These are an essential piece of the picture. If anything, one should (?) expect that turnovers are less likely after made field goals. My prior is that dynamic on court action is more conducive to turnovers than taking the ball out of bounds, making a safe pass to the player taking the ball up court, while the defense drifts back and sets up. What you surely don't want to discard are turnovers that are the result of teams trying to push the pace after taking the ball out of bounds.
Back to top
View user's profile Send private message
deepak
Joined: 26 Apr 2006
Posts: 665
PostPosted: Wed Dec 23, 2009 3:13 pm Post subject: Reply with quote
schtevie wrote:
deepak, thanks for the clarifications.
It will be interesting to see how culling out the last plays of the quarters affects the results. Perhaps this will completely "clean up" the "possession after made field goal" anomaly, but my guess is that the uptick will remain. There is no particular reason to believe that end of quarter plays disproportionately occur after made field goals (not that you are saying they are). Edit/post script: And culling out the end of quarter plays that take slightly longer should correspondingly raise their ORTGs as well.
A closer look at the numbers. In the second graph, I filtered out possessions in last 10 seconds and also possessions after timeouts. As you suspected, it did not make a significant difference:
schtevie wrote:
And as for turnovers, why would you want to discard these? These are an essential piece of the picture. If anything, one should (?) expect that turnovers are less likely after made field goals. My prior is that dynamic on court action is more conducive to turnovers than taking the ball out of bounds, making a safe pass to the player taking the ball up court, while the defense drifts back and sets up. What you surely don't want to discard are turnovers that are the result of teams trying to push the pace after taking the ball out of bounds.
When I also discard turnover possessions ...
What I suspected was happening was that there was a disproportionate number of turnovers for shorter possessions than longer possessions. Why? Because a team is less likely to get a shot off after a made field goal with in the first 10 seconds. So if poss_first_time is within 10 seconds, that means a relatively larger fraction of them were due to turnovers.
So, my thinking is that this last chart is a better indicator of the quality of shots a team is able to generate as a function of poss_first_time.
Edit: Just checked the TOV% for HOU and the League as a function of poss_first_time, after made field goal (again, excluding timeouts and last 10 seconds of period). My conjecture was correct:
Back to top
View user's profile Send private message
schtevie
Joined: 18 Apr 2005
Posts: 411
PostPosted: Wed Dec 23, 2009 4:57 pm Post subject: Reply with quote
Wow, this is really great. New data, generated in real time! And they are interestinger and interestinger.
Taking tranche one, I note the robustness of the result: the alleged sub-optimality of NBA-average (and Houston) "post mfg" offense. And though I understand and agree with the argument that one should cull out possessions beginning within ten seconds of period's end, I do not with regards to post time-out possessions. For these purposes, lumping all out of bounds plays together seems most reasonable.
And by the way, in that regard, where in the data is the offense occurring after a made final free throw? Is it there at all? These too should be in the "ball taken out of bounds" mix, no?
And now for a mea culpa. In trying to estimate the effect of Houston's hurried post-mfg offense, I made not one but two errors (one transcription and one math). Dang. The long and the short of it is that imprudent action after made field goals (10 seconds left in the quarter and time out inclusive) costs Houston not 0.90 but 2.12 points per 100 possessions. Conversely, hurried post-dr offense has cost Houston only 1.19 points per 100 possessions (not 2.4). The total being 3.31 (essentially the same total as with the math errors). I should also say that these numbers are biased high, in that some of the Houston opponent made field goals were and-ones and not direct Houston scoring opportunities (but then again, if the post-final opponent free throw results are similar to post-made fg results, these estimates are biased low.....make sense?)
And from this (now corrected) base, I note that culling out the end of quarter and post-time out data would have the effect of reducing the foregone 2.12 points per 100 possessions to something less than 1.73. (To make the correct adjustment, I would need to know, on average, how many post-time-out, end of quarter post made-mfg possessions there are in a game). Regardless, the loss in efficiency on account of hurried offense, post-mfg, is non-trivial.
Moving on then to the second tranche, where, in addition, all turnovers are culled from the post-mfg sample, I was prepared to offer a "Aside from that, Mrs. Lincoln, how did you enjoy the show?" type comment (as turnovers are an integral part of the offensive calculation and not something that can be eliminated a priori) but lo and behold, the sub-optimality remains! It isn't just the extra turnovers that came about in rushing shots that drive the result, it seems it is the low quality of rushed shots as well!
Re: Recovered old threads- miscellaneous topics
deepak
Joined: 26 Apr 2006
Posts: 664
PostPosted: Wed Dec 23, 2009 5:45 pm Post subject: Reply with quote
Schtevie, how did you determine that Houston is losing 2.12 points per possession by pushing the ball after made field goals? I can't figure out what formula you're using.
Back to top
View user's profile Send private message
schtevie
Joined: 18 Apr 2005
Posts: 408
PostPosted: Wed Dec 23, 2009 6:27 pm Post subject: Reply with quote
deepak, the basis is calculating from your data the opportunity cost of rushing the offense (after a made fg). The average result 10 seconds or less into the clock yields an ORTG of 1.01. The average result 15 seconds or more into the shot clock yields an ORTG of 1.06. Or an expected counterfactual gain of waiting of 0.05 points per originating possession.
From there, we turn to B-R.com to see that there have been a per game average of 38 made shots by Houston opponents, which implies 2 points per game foregone (again see my caveat about and-ones, etc.). Then Houston has averaged 94 possessions per game, and the result is 2.12 per 100 possessions.
Make sense?
Back to top
View user's profile Send private message
deepak
Joined: 26 Apr 2006
Posts: 664
PostPosted: Wed Dec 23, 2009 11:23 pm Post subject: Reply with quote
schtevie wrote:
deepak, the basis is calculating from your data the opportunity cost of rushing the offense (after a made fg). The average result 10 seconds or less into the clock yields an ORTG of 1.01. The average result 15 seconds or more into the shot clock yields an ORTG of 1.06. Or an expected counterfactual gain of waiting of 0.05 points per originating possession.
From there, we turn to B-R.com to see that there have been a per game average of 38 made shots by Houston opponents, which implies 2 points per game foregone (again see my caveat about and-ones, etc.). Then Houston has averaged 94 possessions per game, and the result is 2.12 per 100 possessions.
Make sense?
Thanks, I get it now. We have this fact:
If the Rockets efficiency on possessions where they shoot or turn it over within 10 seconds is the same as possessions where they shoot or turn it over after 10 seconds, then they would (overall) scored 2.12 points more per 100 offensive possessions.
But is the gap in efficiency really due to "hurrying" the offense? I'm not convinced of this. In the natural flow a possession, assuming a defense that is trying, the offensive team requires time to move the ball and generate a good shot. In other words, it is not the case that there is equal probability of a shot being taken at any point during the possession. The chances of a shot being taken, indeed, increase as the possession persists. What about turnovers? It is possible that the chances of a turnover increase as the possession persists as well, but I would suggest that the "turnover probability curve" is flatter. The net effect is that the % of short possessions ending in a turnover will be more than the % of long possessions ending in a turnover. Consequentially, the ORTG for the short possessions will be lower. To me, this is quite natural.
Let's suppose that a team endeavored not to hurry possessions after a made FG. What would happen is that this team will rarely take a shot within the first 10 seconds. But will they also not the turn the ball over? That's less in their control, so the answer is no. They will still the turnover the ball, perhaps at a somewhat lesser rate, but they will also not get many quick scores. So, again, the ORTG on the early possessions will be low.
Quote:
Moving on then to the second tranche, where, in addition, all turnovers are culled from the post-mfg sample, I was prepared to offer a "Aside from that, Mrs. Lincoln, how did you enjoy the show?" type comment (as turnovers are an integral part of the offensive calculation and not something that can be eliminated a priori) but lo and behold, the sub-optimality remains! It isn't just the extra turnovers that came about in rushing shots that drive the result, it seems it is the low quality of rushed shots as well!
How so? I found the ORTG for <10 to be 139, and for >10 it is 124. For the league as whole, it was 131 and 122, respectively.
Back to top
View user's profile Send private message
schtevie
Joined: 18 Apr 2005
Posts: 408
PostPosted: Thu Dec 24, 2009 10:31 am Post subject: Reply with quote
deepak_e wrote:
Thanks, I get it now. We have this fact:
If the Rockets efficiency on possessions where they shoot or turn it over within 10 seconds is the same as possessions where they shoot or turn it over after 10 seconds, then they would (overall) scored 2.12 points more per 100 offensive possessions.
Well and concisely summarized. But I think an additional point should be made. This factoid represents a comparison of averages. In theory, and surely in fact, part of the Rockets' "hurry up offense" consists of smart plays, gimmes really, and some which represent some bad choices. The latter is what should be culled, and if so, the 2.12 points is a lower bound compared to the hypothetical optimum.
And this leads to a more general point. What is so neat about your presentation of the data is that you broke it down enough to clearly illustrate what is a league-wide phenomenon. However, given this established fact, it makes no sense to believe that haste makes waste only after made field goals. The same phenomenon surely applies to other possession origins. Indeed after defensive rebounds we also see the Rushing Rockets. This reality is simply obscured because of the greater propensity to fast break (with offsetting high returns) after "dynamic" possession origins.
deepak_e wrote:
But is the gap in efficiency really due to "hurrying" the offense? I'm not convinced of this. In the natural flow a possession, assuming a defense that is trying, the offensive team requires time to move the ball and generate a good shot. In other words, it is not the case that there is equal probability of a shot being taken at any point during the possession. The chances of a shot being taken, indeed, increase as the possession persists. What about turnovers? It is possible that the chances of a turnover increase as the possession persists as well, but I would suggest that the "turnover probability curve" is flatter. The net effect is that the % of short possessions ending in a turnover will be more than the % of long possessions ending in a turnover. Consequentially, the ORTG for the short possessions will be lower. To me, this is quite natural.
Let's suppose that a team endeavored not to hurry possessions after a made FG. What would happen is that this team will rarely take a shot within the first 10 seconds. But will they also not the turn the ball over? That's less in their control, so the answer is no. They will still the turnover the ball, perhaps at a somewhat lesser rate, but they will also not get many quick scores. So, again, the ORTG on the early possessions will be low.
I am not exactly sure how best to disentangle the various points here. In the particular instance of the Rockets, compared to the rest of the league, they are clearly hurrying, in the sense that whether one includes turnovers or not as part of the mix, they are "dispensing" a higher proportion of their post made field goal possessions within the first ten seconds. More generally, there is the larger point, THE LAW (which should accord with everyone's intuition) is that with optimal play, one should not observe anything but a monotonically declining plot of ORTG vs. the elapsed clock time. If certain choices/actions are made that result in a rising portion of this plot, it is necessarily the case that some fraction of these shouldn't have been made as there were prospective realizable opportunities of higher expected return. This logic is robust to any specification of the rate of turnovers within the shot clock (ignoring the degenerate case where the expected likelihood of an immediate future turnovers is so high as to never make it optimal to pass the ball - but never mind that.)[/quote]
deepak_e wrote:
Quote:
Moving on then to the second tranche, where, in addition, all turnovers are culled from the post-mfg sample, I was prepared to offer a "Aside from that, Mrs. Lincoln, how did you enjoy the show?" type comment (as turnovers are an integral part of the offensive calculation and not something that can be eliminated a priori) but lo and behold, the sub-optimality remains! It isn't just the extra turnovers that came about in rushing shots that drive the result, it seems it is the low quality of rushed shots as well!
How so? I found the ORTG for <10 to be 139, and for >10 it is 124. For the league as whole, it was 131 and 122, respectively.
I was only referring to the rise in ORTG between five and ten seconds. But the more general point is that in terms of discussing the optimality of play it is illegitimate to look at the non-turnover data alone. As the likelihood of committing turnovers is one of the choice variables.
Finally, deepak could you address the issue of where the post-made final free throw data is or isn't? Not that Christmas hasn't come early here, but it would be nice to know where that is, and if it can be included in the general "out of bounds" originating possession category.
Back to top
View user's profile Send private message
deepak
Joined: 26 Apr 2006
Posts: 664
PostPosted: Thu Dec 24, 2009 12:34 pm Post subject: Reply with quote
schtevie wrote:
I am not exactly sure how best to disentangle the various points here. In the particular instance of the Rockets, compared to the rest of the league, they are clearly hurrying, in the sense that whether one includes turnovers or not as part of the mix, they are "dispensing" a higher proportion of their post made field goal possessions within the first ten seconds. More generally, there is the larger point, THE LAW (which should accord with everyone's intuition) is that with optimal play, one should not observe anything but a monotonically declining plot of ORTG vs. the elapsed clock time. If certain choices/actions are made that result in a rising portion of this plot, it is necessarily the case that some fraction of these shouldn't have been made as there were prospective realizable opportunities of higher expected return. This logic is robust to any specification of the rate of turnovers within the shot clock (ignoring the degenerate case where the expected likelihood of an immediate future turnovers is so high as to never make it optimal to pass the ball - but never mind that.)
I still think that the law isn't strictly applicable, especially early in a possession. Suppose I reduced the time granularity to 2 second intervals instead of 5. Within the first 2 seconds, it is very rare, almost impossible, for any team to even attempt a shot (especially considering that the game clock doesn't stop after a made field goal). So, for poss_first_time to be less than 2 seconds, its overwhelmingly likely that the possession simply ended in a turnover. But you're law would tell us that even in the first 2 seconds we should expect a very high ORTG. To me, that would be incredible if it actually happened.
So, instead of a monotonically decreasing curve, what I believe we should expect is a curve that starts at zero and peaks perhaps somewhere between 5 and 10 seconds, and then decreases. This is roughly the shape we observe.
Quote:
deepak_e wrote:
How so? I found the ORTG for <10 to be 139, and for >10 it is 124. For the league as whole, it was 131 and 122, respectively.
I was only referring to the rise in ORTG between five and ten seconds. But the more general point is that in terms of discussing the optimality of play it is illegitimate to look at the non-turnover data alone. As the likelihood of committing turnovers is one of the choice variables.
Thanks. Again, I would say that the chances of a shot being taken is so much lower than the chances of turnover being committed very early in a possession (and that's irrespective of how "hurried" a team is playing). A team can turn the ball over without trying to hurry their offense. But if a team is attempting shots early in a possession, they are trying to do something early. So, by discarding the turnover possessions, my thinking is we obtain a more accurate relationship of cost/benefit of rushing an offense. Now, that I think about it, it is strange to me that within the first 5 seconds the ORTG would be less than between 5-10 seconds when discarding turnovers. Could it be a sample size fluke (less than 2% of possessions after a made field goal end within 5 seconds)?
I think what I will try to show is a curve representing the likelihood of a turnover being committing at t seconds from the start of a possession, and a corresponding curve representing the likelihood of a shot or drawn shooting foul at t seconds from the start of a possession. As I understand it, your law assumes that these curves have a similar shape in general. If that was true, then indeed I would also expect monotonically decreasing ORTG as a function of possession time (or poss_first_time). But, as I mentioned in some prior posts, I expect the TOV curve to be flatter.
Quote:
Finally, deepak could you address the issue of where the post-made final free throw data is or isn't? Not that Christmas hasn't come early here, but it would be nice to know where that is, and if it can be included in the general "out of bounds" originating possession category.
Sure. I agree that would be interesting to look at. I'll post that some time later today.
Back to top
View user's profile Send private message
schtevie
Joined: 18 Apr 2005
Posts: 408
PostPosted: Thu Dec 24, 2009 4:21 pm Post subject: Reply with quote
deepak_e wrote:
I still think that the law isn't strictly applicable, especially early in a possession. Suppose I reduced the time granularity to 2 second intervals instead of 5. Within the first 2 seconds, it is very rare, almost impossible, for any team to even attempt a shot (especially considering that the game clock doesn't stop after a made field goal). So, for poss_first_time to be less than 2 seconds, its overwhelmingly likely that the possession simply ended in a turnover. But you're law would tell us that even in the first 2 seconds we should expect a very high ORTG. To me, that would be incredible if it actually happened.
So, instead of a monotonically decreasing curve, what I believe we should expect is a curve that starts at zero and peaks perhaps somewhere between 5 and 10 seconds, and then decreases. This is roughly the shape we observe.
I appreciate the precise reading, and, of course, you have identified the exception that proves the rule, the law? the rule of law? Clearly, for THE LAW to hold, there need to be concurrent relevant scoring opportunities. And the necessity of bringing the ball past half-court before initiating the offense provides for the possibility and realization of turnovers that one cannot assign a priori to a hurried vs. non-hurried offense.
The issue is whether this class of turnovers is sufficiently empirically relevant to overturn my claim. Clearly, the instance where a guard is casually walking the ball up-court after a made basket and dribbles the ball off his foot would result in a misattribution. But my strong prior is that if a team is turning the ball over early in the running game clock (as opposed to shot clock) it is disproportionately because it is forcing the issue by pushing the ball upcourt. Sorting this out is an important issue, but my guess is that it isn't going to change the picture.
deepak_e wrote:
Quote:
deepak_e wrote:
How so? I found the ORTG for <10 to be 139, and for >10 it is 124. For the league as whole, it was 131 and 122, respectively.
I was only referring to the rise in ORTG between five and ten seconds. But the more general point is that in terms of discussing the optimality of play it is illegitimate to look at the non-turnover data alone. As the likelihood of committing turnovers is one of the choice variables.
Thanks. Again, I would say that the chances of a shot being taken is so much lower than the chances of turnover being committed very early in a possession (and that's irrespective of how "hurried" a team is playing). A team can turn the ball over without trying to hurry their offense. But if a team is attempting shots early in a possession, they are trying to do something early. So, by discarding the turnover possessions, my thinking is we obtain a more accurate relationship of cost/benefit of rushing an offense. Now, that I think about it, it is strange to me that within the first 5 seconds the ORTG would be less than between 5-10 seconds when discarding turnovers. Could it be a sample size fluke (less than 2% of possessions after a made field goal end within 5 seconds)?
If it is a sample size fluke, the sample includes the entire NBA, so I think there is more going on. Thinking out loud, I don't know if there is a clever way to deal with the back-court turnover issue - making a benign assumption about turnovers occurring within a certain period of the running game clock being apportioned proportionately to certain time segments?
Back to top
View user's profile Send private message
deepak
Joined: 26 Apr 2006
Posts: 664
PostPosted: Mon Dec 28, 2009 6:33 pm Post subject: Reply with quote
Sorry for the delay in getting back to this. Below shows a detailed chart for possession categorized with the "OTHER" trigger. This basically refers to possessions originating from out of bounds, but not after a made field goal (including made free throws and non-steal turnovers).
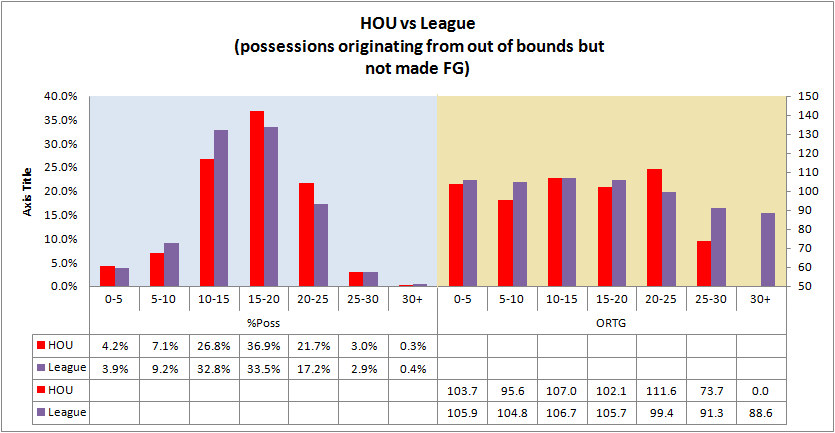
And, for comparison, possessions after made FG:

In both cases, I've retained possessions including timeouts, but have removed possessions occurring in the last 10 seconds of quarters. All data is updated for games through 12/27.
I was a little puzzled that teams get into their offense slower, on average, after a made FG than they would from out-of-bounds otherwise (17.4s to 15s), but then it dawned on me that (of course) teams could take the ball out from midcourt which would get them into their offense sooner.
Back to top
View user's profile Send private message
schtevie
Joined: 18 Apr 2005
Posts: 408
PostPosted: Tue Dec 29, 2009 4:27 pm Post subject: Reply with quote
deepak, all the numbers are great, and more is always better than less. However, having digested all of them, and your valuable commentary, it seems to me that they are not yet of the form to best address the question that is of interest to me and hopefully you (and others) as well: do NBA teams (perhaps the Rockets in particular) optimize their offenses according to the constraints of the shot clock?
In the form the data is presented, it seems pretty clear (to me) that there is evidence that teams don't, at least after made baskets. And with other possession origins, it is yet possible to find such evidence.
Assuming you are interested in going further with this topic, let me make some positive suggestions.
(1) With regard to possessions after made field goals, you note that the game clock continues running so the data doesn't coincide with the shot clock. As I estimate the lag, it is very typically about three seconds. As such, I would propose picking a lag (2, 3, or 4 seconds) and staggering the data accordingly. Additionally, I would propose breaking the time units to 2 seconds rather than 5. Such a finer gradation would let one get a better sense of the data to see to what extent the "hurried offense" theory is actually there. (And I suggest 2, rather than 3 or 4, because there is minor value in making the hypothetical first 10 seconds of the presumed shot clock an endpoint, as beyond then, defensive "procedural errors" result in a 14 second reset of the shot clock.) Additionally, I would not lump together all events after 30 seconds. When sample sizes get large enough, the declining ORTG should be exhibited throughout the elapsed clock.
(2) As for lumping possession origins, I would combine made last (non-technicals) free throws in with made (non-fouled) field goal possession origins. These have a common throw-in location, as well as a (presumably) common game reality, where most of a similar segment of the defense is largely back at which time the ball is in-bounded. (And similarly, all side-in-bounding possession origins, I would lump into one. With the complication that some occur within an existing shot clock, but whatever.)
(3) For all other possession origins, I would try to separate out the fast breaks that disproportionately result from steals and defensive rebounds. Either eyeball the data to get an estimate or pick a time where the vast majority of dunks, lay-ups or kick-out 3s are expected to have occurred. My sense is that 3 or 4 seconds is a better measure of this than 5 seconds. And the extra second or two could well matter. The interest - again, my interest, at least - is to see that when the attempted fast break doesn't pan out, whether offensive play is thereafter optimized with respect to the shot clock.
(4) The same approach can be taken with possessions originating with offensive rebounds. I list this separately only because I haven't seen separate mention of this possession origin yet. Have I been missing something in this regard?
Thanks again for all the work, and I at least think it is really important stuff.
Back to top
View user's profile Send private message
deepak
Joined: 26 Apr 2006
Posts: 664
PostPosted: Tue Dec 29, 2009 5:45 pm Post subject: Reply with quote
Thanks for the valuable comments.
Thus far, I have split the data based on possession origin. By the common definition of possession, it can not start with an offensive rebound. I do also have a "play trigger" field in which I make record plays starting with offensive rebounds.
Back to top
View user's profile Send private message
schtevie
Joined: 18 Apr 2005
Posts: 408
PostPosted: Tue Dec 29, 2009 6:24 pm Post subject: Reply with quote
deepak, perhaps this is a bit late in the conversation, but could you please clarify for me the meaning of the measure ORTG, as you use it in your charts.
As you explicitly write, the times represent the time of first events (shot attempt, shooting foul, turnover). Offensive rating however is defined as points per possession, which is inclusive of the points scored after offensive rebounds. Do the ORTGs listed at each time segment include all points that occur on missed shots that are subsequently offensively rebounded with resulting scores?
Back to top
View user's profile Send private message
deepak
Joined: 26 Apr 2006
Posts: 664
PostPosted: Tue Dec 29, 2009 8:29 pm Post subject: Reply with quote
schtevie wrote:
deepak, perhaps this is a bit late in the conversation, but could you please clarify for me the meaning of the measure ORTG, as you use it in your charts.
As you explicitly write, the times represent the time of first events (shot attempt, shooting foul, turnover). Offensive rating however is defined as points per possession, which is inclusive of the points scored after offensive rebounds. Do the ORTGs listed at each time segment include all points that occur on missed shots that are subsequently offensively rebounded with resulting scores?
Yes. It is points scored on possessions where a shot is taken, or the possession ends, within t seconds (or poss_first_time < t). So, if a team pushes the ball up the floor and shoots a 3 between 5 and 10 seconds, that gets categorized as a 5-10 possession. If they miss it, get the rebound, and eventually score, the ORTG will reflect that score even if it did not come within 10 seconds.
Another possibility is to discard all actions that take place after the first miss. So if a team shoot and misses a 3-pointer within 10 seconds, they get 0 credit for that possession even if they rebound and score sometime later. Do you think that could be more useful?
Back to top
View user's profile Send private message
schtevie
Joined: 18 Apr 2005
Posts: 408
PostPosted: Wed Dec 30, 2009 8:21 am Post subject: Reply with quote
No, no, no. It is certainly most useful as is.
As is, at any chosen time, if one takes a weighted average of frequency and ORTG from that time forward, one gets the best estimate of the shot/scoring threshold immediately prior. That is, if the potential/realized opportunity at t-1 does not exceed said threshold, a team should expect to do better by moving the ball along and staying with the offense.
Again, however, it would be very interesting to also break out the "plays" of first offensive rebounds, and then treat these data identically to "conventional" possession origins. That is, keep the same definition for ORTG for each time segment, where the points scored on subsequent offensive rebounds are included. In this way, as previously noted, one can check the offensive optimality with respect to the shot clock for "possessions" beginning with offensive rebounds.
One reason that taking offensive rebounds separately into account is of interest is to address the possibility that an offense might appear to be playing "clock-optimal" basketball after conventionally-defined possession origins, but this might only be a consequence of suboptimal play after offensive rebounds. If shots are rushed after offensive rebounds, this has the effect of lowering the preceding shot thresholds. Likely a minor point, but part of the complete picture.
Joined: 26 Apr 2006
Posts: 664
PostPosted: Wed Dec 23, 2009 5:45 pm Post subject: Reply with quote
Schtevie, how did you determine that Houston is losing 2.12 points per possession by pushing the ball after made field goals? I can't figure out what formula you're using.
Back to top
View user's profile Send private message
schtevie
Joined: 18 Apr 2005
Posts: 408
PostPosted: Wed Dec 23, 2009 6:27 pm Post subject: Reply with quote
deepak, the basis is calculating from your data the opportunity cost of rushing the offense (after a made fg). The average result 10 seconds or less into the clock yields an ORTG of 1.01. The average result 15 seconds or more into the shot clock yields an ORTG of 1.06. Or an expected counterfactual gain of waiting of 0.05 points per originating possession.
From there, we turn to B-R.com to see that there have been a per game average of 38 made shots by Houston opponents, which implies 2 points per game foregone (again see my caveat about and-ones, etc.). Then Houston has averaged 94 possessions per game, and the result is 2.12 per 100 possessions.
Make sense?
Back to top
View user's profile Send private message
deepak
Joined: 26 Apr 2006
Posts: 664
PostPosted: Wed Dec 23, 2009 11:23 pm Post subject: Reply with quote
schtevie wrote:
deepak, the basis is calculating from your data the opportunity cost of rushing the offense (after a made fg). The average result 10 seconds or less into the clock yields an ORTG of 1.01. The average result 15 seconds or more into the shot clock yields an ORTG of 1.06. Or an expected counterfactual gain of waiting of 0.05 points per originating possession.
From there, we turn to B-R.com to see that there have been a per game average of 38 made shots by Houston opponents, which implies 2 points per game foregone (again see my caveat about and-ones, etc.). Then Houston has averaged 94 possessions per game, and the result is 2.12 per 100 possessions.
Make sense?
Thanks, I get it now. We have this fact:
If the Rockets efficiency on possessions where they shoot or turn it over within 10 seconds is the same as possessions where they shoot or turn it over after 10 seconds, then they would (overall) scored 2.12 points more per 100 offensive possessions.
But is the gap in efficiency really due to "hurrying" the offense? I'm not convinced of this. In the natural flow a possession, assuming a defense that is trying, the offensive team requires time to move the ball and generate a good shot. In other words, it is not the case that there is equal probability of a shot being taken at any point during the possession. The chances of a shot being taken, indeed, increase as the possession persists. What about turnovers? It is possible that the chances of a turnover increase as the possession persists as well, but I would suggest that the "turnover probability curve" is flatter. The net effect is that the % of short possessions ending in a turnover will be more than the % of long possessions ending in a turnover. Consequentially, the ORTG for the short possessions will be lower. To me, this is quite natural.
Let's suppose that a team endeavored not to hurry possessions after a made FG. What would happen is that this team will rarely take a shot within the first 10 seconds. But will they also not the turn the ball over? That's less in their control, so the answer is no. They will still the turnover the ball, perhaps at a somewhat lesser rate, but they will also not get many quick scores. So, again, the ORTG on the early possessions will be low.
Quote:
Moving on then to the second tranche, where, in addition, all turnovers are culled from the post-mfg sample, I was prepared to offer a "Aside from that, Mrs. Lincoln, how did you enjoy the show?" type comment (as turnovers are an integral part of the offensive calculation and not something that can be eliminated a priori) but lo and behold, the sub-optimality remains! It isn't just the extra turnovers that came about in rushing shots that drive the result, it seems it is the low quality of rushed shots as well!
How so? I found the ORTG for <10 to be 139, and for >10 it is 124. For the league as whole, it was 131 and 122, respectively.
Back to top
View user's profile Send private message
schtevie
Joined: 18 Apr 2005
Posts: 408
PostPosted: Thu Dec 24, 2009 10:31 am Post subject: Reply with quote
deepak_e wrote:
Thanks, I get it now. We have this fact:
If the Rockets efficiency on possessions where they shoot or turn it over within 10 seconds is the same as possessions where they shoot or turn it over after 10 seconds, then they would (overall) scored 2.12 points more per 100 offensive possessions.
Well and concisely summarized. But I think an additional point should be made. This factoid represents a comparison of averages. In theory, and surely in fact, part of the Rockets' "hurry up offense" consists of smart plays, gimmes really, and some which represent some bad choices. The latter is what should be culled, and if so, the 2.12 points is a lower bound compared to the hypothetical optimum.
And this leads to a more general point. What is so neat about your presentation of the data is that you broke it down enough to clearly illustrate what is a league-wide phenomenon. However, given this established fact, it makes no sense to believe that haste makes waste only after made field goals. The same phenomenon surely applies to other possession origins. Indeed after defensive rebounds we also see the Rushing Rockets. This reality is simply obscured because of the greater propensity to fast break (with offsetting high returns) after "dynamic" possession origins.
deepak_e wrote:
But is the gap in efficiency really due to "hurrying" the offense? I'm not convinced of this. In the natural flow a possession, assuming a defense that is trying, the offensive team requires time to move the ball and generate a good shot. In other words, it is not the case that there is equal probability of a shot being taken at any point during the possession. The chances of a shot being taken, indeed, increase as the possession persists. What about turnovers? It is possible that the chances of a turnover increase as the possession persists as well, but I would suggest that the "turnover probability curve" is flatter. The net effect is that the % of short possessions ending in a turnover will be more than the % of long possessions ending in a turnover. Consequentially, the ORTG for the short possessions will be lower. To me, this is quite natural.
Let's suppose that a team endeavored not to hurry possessions after a made FG. What would happen is that this team will rarely take a shot within the first 10 seconds. But will they also not the turn the ball over? That's less in their control, so the answer is no. They will still the turnover the ball, perhaps at a somewhat lesser rate, but they will also not get many quick scores. So, again, the ORTG on the early possessions will be low.
I am not exactly sure how best to disentangle the various points here. In the particular instance of the Rockets, compared to the rest of the league, they are clearly hurrying, in the sense that whether one includes turnovers or not as part of the mix, they are "dispensing" a higher proportion of their post made field goal possessions within the first ten seconds. More generally, there is the larger point, THE LAW (which should accord with everyone's intuition) is that with optimal play, one should not observe anything but a monotonically declining plot of ORTG vs. the elapsed clock time. If certain choices/actions are made that result in a rising portion of this plot, it is necessarily the case that some fraction of these shouldn't have been made as there were prospective realizable opportunities of higher expected return. This logic is robust to any specification of the rate of turnovers within the shot clock (ignoring the degenerate case where the expected likelihood of an immediate future turnovers is so high as to never make it optimal to pass the ball - but never mind that.)[/quote]
deepak_e wrote:
Quote:
Moving on then to the second tranche, where, in addition, all turnovers are culled from the post-mfg sample, I was prepared to offer a "Aside from that, Mrs. Lincoln, how did you enjoy the show?" type comment (as turnovers are an integral part of the offensive calculation and not something that can be eliminated a priori) but lo and behold, the sub-optimality remains! It isn't just the extra turnovers that came about in rushing shots that drive the result, it seems it is the low quality of rushed shots as well!
How so? I found the ORTG for <10 to be 139, and for >10 it is 124. For the league as whole, it was 131 and 122, respectively.
I was only referring to the rise in ORTG between five and ten seconds. But the more general point is that in terms of discussing the optimality of play it is illegitimate to look at the non-turnover data alone. As the likelihood of committing turnovers is one of the choice variables.
Finally, deepak could you address the issue of where the post-made final free throw data is or isn't? Not that Christmas hasn't come early here, but it would be nice to know where that is, and if it can be included in the general "out of bounds" originating possession category.
Back to top
View user's profile Send private message
deepak
Joined: 26 Apr 2006
Posts: 664
PostPosted: Thu Dec 24, 2009 12:34 pm Post subject: Reply with quote
schtevie wrote:
I am not exactly sure how best to disentangle the various points here. In the particular instance of the Rockets, compared to the rest of the league, they are clearly hurrying, in the sense that whether one includes turnovers or not as part of the mix, they are "dispensing" a higher proportion of their post made field goal possessions within the first ten seconds. More generally, there is the larger point, THE LAW (which should accord with everyone's intuition) is that with optimal play, one should not observe anything but a monotonically declining plot of ORTG vs. the elapsed clock time. If certain choices/actions are made that result in a rising portion of this plot, it is necessarily the case that some fraction of these shouldn't have been made as there were prospective realizable opportunities of higher expected return. This logic is robust to any specification of the rate of turnovers within the shot clock (ignoring the degenerate case where the expected likelihood of an immediate future turnovers is so high as to never make it optimal to pass the ball - but never mind that.)
I still think that the law isn't strictly applicable, especially early in a possession. Suppose I reduced the time granularity to 2 second intervals instead of 5. Within the first 2 seconds, it is very rare, almost impossible, for any team to even attempt a shot (especially considering that the game clock doesn't stop after a made field goal). So, for poss_first_time to be less than 2 seconds, its overwhelmingly likely that the possession simply ended in a turnover. But you're law would tell us that even in the first 2 seconds we should expect a very high ORTG. To me, that would be incredible if it actually happened.
So, instead of a monotonically decreasing curve, what I believe we should expect is a curve that starts at zero and peaks perhaps somewhere between 5 and 10 seconds, and then decreases. This is roughly the shape we observe.
Quote:
deepak_e wrote:
How so? I found the ORTG for <10 to be 139, and for >10 it is 124. For the league as whole, it was 131 and 122, respectively.
I was only referring to the rise in ORTG between five and ten seconds. But the more general point is that in terms of discussing the optimality of play it is illegitimate to look at the non-turnover data alone. As the likelihood of committing turnovers is one of the choice variables.
Thanks. Again, I would say that the chances of a shot being taken is so much lower than the chances of turnover being committed very early in a possession (and that's irrespective of how "hurried" a team is playing). A team can turn the ball over without trying to hurry their offense. But if a team is attempting shots early in a possession, they are trying to do something early. So, by discarding the turnover possessions, my thinking is we obtain a more accurate relationship of cost/benefit of rushing an offense. Now, that I think about it, it is strange to me that within the first 5 seconds the ORTG would be less than between 5-10 seconds when discarding turnovers. Could it be a sample size fluke (less than 2% of possessions after a made field goal end within 5 seconds)?
I think what I will try to show is a curve representing the likelihood of a turnover being committing at t seconds from the start of a possession, and a corresponding curve representing the likelihood of a shot or drawn shooting foul at t seconds from the start of a possession. As I understand it, your law assumes that these curves have a similar shape in general. If that was true, then indeed I would also expect monotonically decreasing ORTG as a function of possession time (or poss_first_time). But, as I mentioned in some prior posts, I expect the TOV curve to be flatter.
Quote:
Finally, deepak could you address the issue of where the post-made final free throw data is or isn't? Not that Christmas hasn't come early here, but it would be nice to know where that is, and if it can be included in the general "out of bounds" originating possession category.
Sure. I agree that would be interesting to look at. I'll post that some time later today.
Back to top
View user's profile Send private message
schtevie
Joined: 18 Apr 2005
Posts: 408
PostPosted: Thu Dec 24, 2009 4:21 pm Post subject: Reply with quote
deepak_e wrote:
I still think that the law isn't strictly applicable, especially early in a possession. Suppose I reduced the time granularity to 2 second intervals instead of 5. Within the first 2 seconds, it is very rare, almost impossible, for any team to even attempt a shot (especially considering that the game clock doesn't stop after a made field goal). So, for poss_first_time to be less than 2 seconds, its overwhelmingly likely that the possession simply ended in a turnover. But you're law would tell us that even in the first 2 seconds we should expect a very high ORTG. To me, that would be incredible if it actually happened.
So, instead of a monotonically decreasing curve, what I believe we should expect is a curve that starts at zero and peaks perhaps somewhere between 5 and 10 seconds, and then decreases. This is roughly the shape we observe.
I appreciate the precise reading, and, of course, you have identified the exception that proves the rule, the law? the rule of law? Clearly, for THE LAW to hold, there need to be concurrent relevant scoring opportunities. And the necessity of bringing the ball past half-court before initiating the offense provides for the possibility and realization of turnovers that one cannot assign a priori to a hurried vs. non-hurried offense.
The issue is whether this class of turnovers is sufficiently empirically relevant to overturn my claim. Clearly, the instance where a guard is casually walking the ball up-court after a made basket and dribbles the ball off his foot would result in a misattribution. But my strong prior is that if a team is turning the ball over early in the running game clock (as opposed to shot clock) it is disproportionately because it is forcing the issue by pushing the ball upcourt. Sorting this out is an important issue, but my guess is that it isn't going to change the picture.
deepak_e wrote:
Quote:
deepak_e wrote:
How so? I found the ORTG for <10 to be 139, and for >10 it is 124. For the league as whole, it was 131 and 122, respectively.
I was only referring to the rise in ORTG between five and ten seconds. But the more general point is that in terms of discussing the optimality of play it is illegitimate to look at the non-turnover data alone. As the likelihood of committing turnovers is one of the choice variables.
Thanks. Again, I would say that the chances of a shot being taken is so much lower than the chances of turnover being committed very early in a possession (and that's irrespective of how "hurried" a team is playing). A team can turn the ball over without trying to hurry their offense. But if a team is attempting shots early in a possession, they are trying to do something early. So, by discarding the turnover possessions, my thinking is we obtain a more accurate relationship of cost/benefit of rushing an offense. Now, that I think about it, it is strange to me that within the first 5 seconds the ORTG would be less than between 5-10 seconds when discarding turnovers. Could it be a sample size fluke (less than 2% of possessions after a made field goal end within 5 seconds)?
If it is a sample size fluke, the sample includes the entire NBA, so I think there is more going on. Thinking out loud, I don't know if there is a clever way to deal with the back-court turnover issue - making a benign assumption about turnovers occurring within a certain period of the running game clock being apportioned proportionately to certain time segments?
Back to top
View user's profile Send private message
deepak
Joined: 26 Apr 2006
Posts: 664
PostPosted: Mon Dec 28, 2009 6:33 pm Post subject: Reply with quote
Sorry for the delay in getting back to this. Below shows a detailed chart for possession categorized with the "OTHER" trigger. This basically refers to possessions originating from out of bounds, but not after a made field goal (including made free throws and non-steal turnovers).
And, for comparison, possessions after made FG:
In both cases, I've retained possessions including timeouts, but have removed possessions occurring in the last 10 seconds of quarters. All data is updated for games through 12/27.
I was a little puzzled that teams get into their offense slower, on average, after a made FG than they would from out-of-bounds otherwise (17.4s to 15s), but then it dawned on me that (of course) teams could take the ball out from midcourt which would get them into their offense sooner.
Back to top
View user's profile Send private message
schtevie
Joined: 18 Apr 2005
Posts: 408
PostPosted: Tue Dec 29, 2009 4:27 pm Post subject: Reply with quote
deepak, all the numbers are great, and more is always better than less. However, having digested all of them, and your valuable commentary, it seems to me that they are not yet of the form to best address the question that is of interest to me and hopefully you (and others) as well: do NBA teams (perhaps the Rockets in particular) optimize their offenses according to the constraints of the shot clock?
In the form the data is presented, it seems pretty clear (to me) that there is evidence that teams don't, at least after made baskets. And with other possession origins, it is yet possible to find such evidence.
Assuming you are interested in going further with this topic, let me make some positive suggestions.
(1) With regard to possessions after made field goals, you note that the game clock continues running so the data doesn't coincide with the shot clock. As I estimate the lag, it is very typically about three seconds. As such, I would propose picking a lag (2, 3, or 4 seconds) and staggering the data accordingly. Additionally, I would propose breaking the time units to 2 seconds rather than 5. Such a finer gradation would let one get a better sense of the data to see to what extent the "hurried offense" theory is actually there. (And I suggest 2, rather than 3 or 4, because there is minor value in making the hypothetical first 10 seconds of the presumed shot clock an endpoint, as beyond then, defensive "procedural errors" result in a 14 second reset of the shot clock.) Additionally, I would not lump together all events after 30 seconds. When sample sizes get large enough, the declining ORTG should be exhibited throughout the elapsed clock.
(2) As for lumping possession origins, I would combine made last (non-technicals) free throws in with made (non-fouled) field goal possession origins. These have a common throw-in location, as well as a (presumably) common game reality, where most of a similar segment of the defense is largely back at which time the ball is in-bounded. (And similarly, all side-in-bounding possession origins, I would lump into one. With the complication that some occur within an existing shot clock, but whatever.)
(3) For all other possession origins, I would try to separate out the fast breaks that disproportionately result from steals and defensive rebounds. Either eyeball the data to get an estimate or pick a time where the vast majority of dunks, lay-ups or kick-out 3s are expected to have occurred. My sense is that 3 or 4 seconds is a better measure of this than 5 seconds. And the extra second or two could well matter. The interest - again, my interest, at least - is to see that when the attempted fast break doesn't pan out, whether offensive play is thereafter optimized with respect to the shot clock.
(4) The same approach can be taken with possessions originating with offensive rebounds. I list this separately only because I haven't seen separate mention of this possession origin yet. Have I been missing something in this regard?
Thanks again for all the work, and I at least think it is really important stuff.
Back to top
View user's profile Send private message
deepak
Joined: 26 Apr 2006
Posts: 664
PostPosted: Tue Dec 29, 2009 5:45 pm Post subject: Reply with quote
Thanks for the valuable comments.
Thus far, I have split the data based on possession origin. By the common definition of possession, it can not start with an offensive rebound. I do also have a "play trigger" field in which I make record plays starting with offensive rebounds.
Back to top
View user's profile Send private message
schtevie
Joined: 18 Apr 2005
Posts: 408
PostPosted: Tue Dec 29, 2009 6:24 pm Post subject: Reply with quote
deepak, perhaps this is a bit late in the conversation, but could you please clarify for me the meaning of the measure ORTG, as you use it in your charts.
As you explicitly write, the times represent the time of first events (shot attempt, shooting foul, turnover). Offensive rating however is defined as points per possession, which is inclusive of the points scored after offensive rebounds. Do the ORTGs listed at each time segment include all points that occur on missed shots that are subsequently offensively rebounded with resulting scores?
Back to top
View user's profile Send private message
deepak
Joined: 26 Apr 2006
Posts: 664
PostPosted: Tue Dec 29, 2009 8:29 pm Post subject: Reply with quote
schtevie wrote:
deepak, perhaps this is a bit late in the conversation, but could you please clarify for me the meaning of the measure ORTG, as you use it in your charts.
As you explicitly write, the times represent the time of first events (shot attempt, shooting foul, turnover). Offensive rating however is defined as points per possession, which is inclusive of the points scored after offensive rebounds. Do the ORTGs listed at each time segment include all points that occur on missed shots that are subsequently offensively rebounded with resulting scores?
Yes. It is points scored on possessions where a shot is taken, or the possession ends, within t seconds (or poss_first_time < t). So, if a team pushes the ball up the floor and shoots a 3 between 5 and 10 seconds, that gets categorized as a 5-10 possession. If they miss it, get the rebound, and eventually score, the ORTG will reflect that score even if it did not come within 10 seconds.
Another possibility is to discard all actions that take place after the first miss. So if a team shoot and misses a 3-pointer within 10 seconds, they get 0 credit for that possession even if they rebound and score sometime later. Do you think that could be more useful?
Back to top
View user's profile Send private message
schtevie
Joined: 18 Apr 2005
Posts: 408
PostPosted: Wed Dec 30, 2009 8:21 am Post subject: Reply with quote
No, no, no. It is certainly most useful as is.
As is, at any chosen time, if one takes a weighted average of frequency and ORTG from that time forward, one gets the best estimate of the shot/scoring threshold immediately prior. That is, if the potential/realized opportunity at t-1 does not exceed said threshold, a team should expect to do better by moving the ball along and staying with the offense.
Again, however, it would be very interesting to also break out the "plays" of first offensive rebounds, and then treat these data identically to "conventional" possession origins. That is, keep the same definition for ORTG for each time segment, where the points scored on subsequent offensive rebounds are included. In this way, as previously noted, one can check the offensive optimality with respect to the shot clock for "possessions" beginning with offensive rebounds.
One reason that taking offensive rebounds separately into account is of interest is to address the possibility that an offense might appear to be playing "clock-optimal" basketball after conventionally-defined possession origins, but this might only be a consequence of suboptimal play after offensive rebounds. If shots are rushed after offensive rebounds, this has the effect of lowering the preceding shot thresholds. Likely a minor point, but part of the complete picture.
Re: Recovered old threads- miscellaneous topics
johnschuhmann
Joined: 16 Jan 2008
Posts: 25
PostPosted: Thu Dec 24, 2009 12:23 pm Post subject: Lakers Offense and Defense Reply with quote
Kevin did a great job of looking at the Lakers' new identity as the best defensive team in the league on Monday: http://www.basketballprospectus.com/art ... icleid=831
That same morning, I touched on the same thing in Power Rankings. Today, for a Christmas preview, I looked at both sides of the ball during the course of Kobe Bryant's career.
In comparison to the league's average efficiency, this is both the worst offensive and best defensive team the Lakers have had in Bryant's career.
Offense
2009-10: +1.3
1996-97: +1.5
2004-05: +1.8
Defense:
2009-10: -7.4
1999-00: -5.6
2008-09: -3.6
Overall (Off. Diff - Def. Diff), this is the second best Lakers team of Bryant's career...
Overall:
1999-00: +9.0
2009-10: +8.7
1997-98: +8.5
I imagine the offense will improve by April, but it will be interesting to see if they can stay at the top defensively.
More tidbits on tomorrow's games: http://www.nba.com/2009/news/features/j ... index.html
The Celtics' rebounding fall-off is pretty interesting too.
_________________
John Schuhmann, NBA.com
Back to top
View user's profile Send private message
Serhat Ugur (hoopseng)
Joined: 13 Oct 2006
Posts: 209
Location: Basketball Research
PostPosted: Thu Dec 24, 2009 12:55 pm Post subject: Reply with quote
This season's SOS might have an influence on Lakers current success. It would better get factored in your analysis.
_________________
http://www.nbastuffer.com
Back to top
View user's profile Send private message Visit poster's website
back2newbelf
Joined: 21 Jun 2005
Posts: 274
PostPosted: Thu Dec 24, 2009 1:11 pm Post subject: Reply with quote
The Lakers' schedule will, on average, be about 3 points harder *per game* from now on, so I doubt they'll hold first place in DRTG for long.
I'm not really surprised by the C's rebounding. They shipped off their best rebounder and brought in one of the worst offensive rebounding big men in the league.
Back to top
View user's profile Send private message
deepak
Joined: 26 Apr 2006
Posts: 665
PostPosted: Thu Dec 24, 2009 1:30 pm Post subject: Reply with quote
A couple trends from last year that I think are relevant.
The Lakers defense started very strong and tapered off as the season progressed. This is a general trend for the league (as offenses tend to struggle early on), but the effect was particularly strong for last year's Lakers.
Notice also the difference in defense at home and on the road. Here were the home/road splits last year:
Code:
ORTG DRTG
Home 112.8 103.3
Road 112.9 107.1
This year, the home/road splits are:
Code:
ORTG DRTG
Home 109.9 99.7
Road 104.5 98.9
But they've only played 9 road games. Last year, after 7 road games they had a better DRTG on the road than at home too (that also was a home-heavy schedule early). That didn't last as the season progressed.
Back to top
View user's profile Send private message
Serhat Ugur (hoopseng)
Joined: 13 Oct 2006
Posts: 209
Location: Basketball Research
PostPosted: Fri Dec 25, 2009 2:04 am Post subject: Reply with quote
deepak_e wrote:
A couple trends from last year that I think are relevant.
Thanks for sharing the stuff. Very informative...
_________________
http://www.nbastuffer.com
Back to top
View user's profile Send private message Visit poster's website
johnschuhmann
Joined: 16 Jan 2008
Posts: 25
PostPosted: Sun Dec 27, 2009 10:26 am Post subject: Reply with quote
True about the SOS with respect to their defense. And good points by deepak_e.
At one point in December last year, when their defense starting falling off a bit, I asked Derek Fisher about it. Basically, the Lakers had tweaked their defense that season to be more like the Celtics, loading up on the strong side. But as the season went on, their opponents adjusted and looked to attack early and attack the middle of the floor.
And obviously, the addition of Artest is a factor this season. So I wonder if we'll see the same trend defensively.
But it's the offensive end that I find most fascinating. The SOS and road-heavy schedule the rest of the way would seemingly keep the offense down, but we also have to account for Gasol's absence for the first 11 games and Artest making the adjustment to the triangle.
Anyway, something to keep an eye on.
_________________
John Schuhmann, NBA.com
New topic
RocketsFan
Joined: 23 Oct 2005
Posts: 404
PostPosted: Fri Jan 13, 2006 7:20 pm Post subject: WARP Reply with quote
I've just finished doing my own WARP calculations for the 1987-88 season (I chose that year because it featured a lot of great players in their prime), and I was wondering where I might share the methodology. I didn't think this forum would be an appropriate place.
Back to top
View user's profile Send private message Yahoo Messenger
Mike G
Joined: 14 Jan 2005
Posts: 3584
Location: Hendersonville, NC
PostPosted: Fri Jan 13, 2006 7:25 pm Post subject: Reply with quote
You never know what will fly, in here. Go for it.
_________________
`
36% of all statistics are wrong
Back to top
View user's profile Send private message Send e-mail
Ed Küpfer
Joined: 30 Dec 2004
Posts: 785
Location: Toronto
PostPosted: Fri Jan 13, 2006 7:32 pm Post subject: Re: WARP Reply with quote
RocketsFan wrote:
I was wondering where I might share the methodology. I didn't think this forum would be an appropriate place.
This is precisely the appropriate place. Lets see what you got.
_________________
ed
Back to top
View user's profile Send private message Send e-mail
Kevin Pelton
Site Admin
Joined: 30 Dec 2004
Posts: 979
Location: Seattle
PostPosted: Fri Jan 13, 2006 10:46 pm Post subject: Reply with quote
Are you concerned about the length of the explanation? I'm sure we can figure something out if that's the case.
Back to top
View user's profile Send private message Send e-mail Visit poster's website
RocketsFan
Joined: 23 Oct 2005
Posts: 404
PostPosted: Fri Jan 13, 2006 10:49 pm Post subject: Reply with quote
You will need Dean Oliver's Basketball on Paper (BoP). If you don't have this book, buy it. Now.
Calculate Team Offensive and Defensive Possessions. The formulas can be found at basketball-reference.com or in BoP.
Calculate the League Rating (LgPtsPerPoss).
Calculate individual Defensive Rating.
Calculate Points Produced and Player Possessions from BoP.
Divide Team Defensive Possessions among players based on minutes played. That's (TmDPoss/TmMin)*Min. We'll call this Individual Defensive Possessions.
Calculate how many points a team with average players would score with this player at the player's team's pace. The reason for this is that you would have to adjust every player to a league average pace otherwise. The formula is (TmPoss-Poss)*(LgRtg/100)+PProd.
Divide by TmPoss to get the team ORtg.
Calculate points allowed with average players. This is (TmDPoss-DPoss)*LgRtg+DPoss*(DRtg/100).
Divide by TmDPoss to get the team DRtg.
Use the bell curve or pythagorean formula to calculate player winning percentage. I'm using the bell curve.
Wins are then 82*PWPct, and Losses are 82-Wins.
Okay, this is where it gets tricky. I set the replacement level at .200. I figured .300, which I think is what Baseball Prospectus uses for its WARP calculations, would be too high. The percentage of teams that finished below .200 in basketball is higher than those that finished below .300 in baseball. You can change the replacement level to whatever you please.
Calculate points scored if the player is replaced by a replacement player. This is (TmPoss-Poss)*(LgRtg/100)+Poss*(LgRtg/100)*.9505.
Divide by TmPoss to get Replacement ORtg.
Calculate points allowed with the replacement player. This is (TmDPoss-DPoss)*(LgRtg/100)+DPoss*(LgRtg/100)*1.0495.
I use the figures of .9505 and 1.0495, because 95.05^14/(95.05^14+104.95^14) = about .200.
Divide by TmDPoss to get Replacement DRtg.
Calculate replacement winning percentage using the bell curve or pythagorean formula.
Calculate replacement wins and losses.
WARP is Wins-Replacement Wins.
The Top 20 of 1987-88, Player, WARP.
1. Michael Jordan 21.24
2. Charles Barkley 14.65
3. Larry Bird 13.56
4. Clyde Drexler 11.69
5. John Stockton 11.48
6. Hakeem Olajuwon 8.93
7. Magic Johnson 8.74
8. Byron Scott 8.64
9. Kevin McHale 8.63
10. Fat Lever 8.01
11. Dominique Wilkins 7.95
12. Adrian Dantley 7.92
13. Karl Malone 7.84
14. Dale Ellis 7.52
15. Terry Porter 7.47
16. Mark Aguirre 7.43
17. Derek Harper 7.13
18. Jack Sikma 6.90
19. Danny Schayes 6.77
20. Danny Ainge 6.54
That's how I calculate WARP. Sorry about the messy list, but I'm not sure how to make it look more readable. If you have any questions, PM me or just post here.
Back to top
View user's profile Send private message Yahoo Messenger
Mike G
Joined: 14 Jan 2005
Posts: 3584
Location: Hendersonville, NC
PostPosted: Mon Jan 16, 2006 11:01 am Post subject: Reply with quote
I would think Patrick Ewing would have been more instrumental to wins-creation than about half of these players. In a career-low 31 mpg, he averaged 20-8, 3 blk; shot .594 TS%.
At first, I think maybe you're giving too much credit for minutes played. But Danny Schayes did less than Ewing, and he played fewer minutes.
_________________
`
36% of all statistics are wrong
Back to top
View user's profile Send private message Send e-mail
Kevin Pelton
Site Admin
Joined: 30 Dec 2004
Posts: 979
Location: Seattle
PostPosted: Mon Jan 16, 2006 1:48 pm Post subject: Reply with quote
Interesting. I use a very different method to calculate WARP (haven't gone back to 87-88, for Dougstats-related reasons), but still come up with very similar top-end numbers -- Garnett led the league last year with 21.1 WARP.
Back to top
View user's profile Send private message Send e-mail Visit poster's website
RocketsFan
Joined: 23 Oct 2005
Posts: 404
PostPosted: Mon Jan 16, 2006 8:41 pm Post subject: Reply with quote
I found an error in my calculations, so I thought I should update the list.
1. Michael Jordan 19.37
2. Charles Barkley 14.66
3. Larry Bird 12.93
4. John Stockton 12.70
5. Clyde Drexler 11.40
6. Magic Johnson 9.11
7. Hakeem Olajuwon 8.93
8. Kevin McHale 8.75
9. Byron Scott 8.71
10. Fat Lever 8.60
Mike, I think the reason Danny Schayes does so much better than Patrick Ewing is their offensive ratings. Schayes rating is 121.5, while Ewing's is only 108. League was 107.6. Ewing can't be expected to lead a team of average player's to a strong offensive improvement if he's barely above average offensively.
Still, I think the numbers rely too much on offensive and defensive ratings. The top twenty of the lists for the three seasons I've done look good, but it begins to break down after that. WARP has Allen Iverson as the 5th best player on the Sixers in 1999-2000, because his offensive rating was lower than his defensive rating. So much for passing the laugh test. The lesson here? There is no Holy Grail of player ratings.
Back to top
View user's profile Send private message Yahoo Messenger
bchaikin
Joined: 27 Jan 2005
Posts: 687
Location: cleveland, ohio
PostPosted: Mon Jan 16, 2006 10:02 pm Post subject: Reply with quote
The Top 20 of 1987-88, Player, WARP.
1. Michael Jordan 21.24
2. Charles Barkley 14.65
3. Larry Bird 13.56
4. Clyde Drexler 11.69
5. John Stockton 11.48
6. Hakeem Olajuwon 8.93
7. Magic Johnson 8.74
8. Byron Scott 8.64
9. Kevin McHale 8.63
10. Fat Lever 8.01
11. Dominique Wilkins 7.95
12. Adrian Dantley 7.92
13. Karl Malone 7.84
14. Dale Ellis 7.52
15. Terry Porter 7.47
16. Mark Aguirre 7.43
17. Derek Harper 7.13
18. Jack Sikma 6.90
19. Danny Schayes 6.77
20. Danny Ainge 6.54
simulation shows jordan's 87-88 season as the season that generated the most wins from the SG slot in the past 28 seasons (since the 77-78 season when turnovers were first kept). for comparison to the above list here's some wins generated for some SGs from that 87-88 season....
i took a bad team from that year that had poor SG play - the nj nets with SGs otis birdsong and dennis hopson - simulated those 2 SGs each for 40 min/g, then replaced them for 40 min/g with other SGs from around the league (no other changes to the nets sub pattern) in 87-88 to see the difference in wins generated. below are the results:
wins---player replacing birdsong/hopson for 40 min/g at SG on the nets
45----- michael jordan (chi)
44
43
42
41
40
39
38.5--- clyde drexler (por)
38
37
36
35.5--- fat lever (den),
35
34
33.5--- byron scott (lal),
33
32.5---- alvin robertson (san),
32
31.5--- dale ellis (sea),
31----- t.r. dunn (den),
30----- sidney moncrief (mil), rolando blackman (dal),
29
28.5--- danny ainge (bos), reggie miller (ind),
28------ ron harper (cle), bob hansen (uta),
27.5---- craig ehlo (cle), dudley bradley (njn),
27------ joe dumars (det),
26----- john long (ind), ricky pierce (mil),
25.5--- jeff hornacek (pho), del curry (cle), trent tucker (nyk),
25----- quintin dailey (lac), kevin williams (sea),
24.5---- randy wittman (atl), craig hodges (mil), derek smith (sac),
24------ jeff malone (was),
23.5---- gerald wilkins (nyk), mike woodson (lac),
23------ reggie theus (sac),
22.5---- vinnie johnson (det), terry teagle (gsw), darrell griffith (uta),
22
21----- dennis hopson (njn),
20
19.5--- otis birdsong (njn), world free (hou),
19
so for example a slight difference compared to your WARP calculations simulation shows the difference between jordan and drexler as being 6-7 wins as opposed to 9-10, and say ellis and lever being 4 wins versus 0-1...
also on a 40 min/g basis for most seasons simulation typically shows the difference between the best and worst players at a specific position in terms of wins generated as being upwards of 15-17 wins, perhaps slightly more. this 87-88 season shows jordan 23-25 wins above, showing just how truly great his season was statistically...
Back to top
View user's profile Send private message Send e-mail Visit poster's website
Mike G
Joined: 14 Jan 2005
Posts: 3584
Location: Hendersonville, NC
PostPosted: Tue Jan 17, 2006 1:00 pm Post subject: Reply with quote
RocketsFan wrote:
... the reason Danny Schayes does so much better than Patrick Ewing is their offensive ratings. ...
Still, I think the numbers rely too much on offensive and defensive ratings. The top twenty of the lists for the three seasons I've done look good, but it begins to break down after that. WARP has Allen Iverson as the 5th best player on the Sixers in 1999-2000, because his offensive rating was lower than his defensive rating. So much for passing the laugh test...
Well, laughter is good for health. But maybe you are just young enough to 'know better' than to believe your results as of 2000; yet you trust them for bygone eras. The fact is, Danny didn't do anything better than Patrick.
'Offensive Rating' may be good for something, but I don't see how the term hopes to capture 'offense'. In 1988, among the top 10 in this stat, we find offensive wizards like Levingston, Sichting, and Leon Wood (along with Schayes, Jr.)
In 1989, you'll see the standard of offensive excellence was embodied by Rod Higgins, Trent Tucker, Brian Rowsom. (Sidney Lowe didn't have enough minutes to qualify). In 1990, Craig Hodges and Ed Nealy were what Jordan and Malone could only hope to be.
Last year, in this 'stat', Fred Hoiberg led all players of all time; he easily outpaced runners-up Greg Buckner and Anthony Goldwire. What does it mean to have a stat in which the 'best' exemplars are marginal players, often near the ends of their careers?
_________________
`
36% of all statistics are wrong
Back to top
View user's profile Send private message Send e-mail
jkubatko
Joined: 05 Jan 2005
Posts: 702
Location: Columbus, OH
PostPosted: Tue Jan 17, 2006 1:15 pm Post subject: Reply with quote
Mike G wrote:
Last year, in this 'stat', Fred Hoiberg led all players of all time; he easily outpaced runners-up Greg Buckner and Anthony Goldwire. What does it mean to have a stat in which the 'best' exemplars are marginal players, often near the ends of their careers?
Mike, as usual, I'm not sure if you're trying to be clever or not. Offensive ratings for individual players estimate points produced per 100 possessions used. The guys with the top offensive ratings aren't necessarily the best offensive players in the league. Last year, Fred Hoiberg and Greg Buckner were second and third, respectively, in true shooting percentage. Should we throw that out as well? If so, we might as well ingore your "T-Rates," since you make an adjustment for true shooting percentage in your calculations.
_________________
Regards,
Justin Kubatko
Basketball-Reference.com
Back to top
View user's profile Send private message Send e-mail Visit poster's website
94by50
Joined: 01 Jan 2006
Posts: 499
Location: Phoenix
PostPosted: Tue Jan 17, 2006 2:07 pm Post subject: Reply with quote
Plus, that doesn't take into account possessions used. Sure, Hoiberg might have had a 138 rating, but he only used an estimated 290 possessions on the entire season. This was ninth on his own team, and less than 20% of the league's leaders (the top 10 all had at least roughly 1600 possessions).
Last edited by 94by50 on Tue Jan 17, 2006 2:11 pm; edited 1 time in total
Back to top
View user's profile Send private message
Mike G
Joined: 14 Jan 2005
Posts: 3584
Location: Hendersonville, NC
PostPosted: Tue Jan 17, 2006 2:08 pm Post subject: Reply with quote
I'd suggest we not call this 'offensive rating' but rather 'not wasting possessions' or some such thing. Even then, players who seem to do so little in so many minutes may be responsible for uncounted things like team turnovers. Just assigning them their share in proportion to their minutes would impact their rating significantly -- relative to their meager contributions.
Yeah, I have a tendency to try to get some good out of it; even if only a laugh.
Richard Jefferson has about the best TS% in the league, among the better scorers. I multiply his scoring rate by (.610/.525)^.5; where .610 is RJ's TS%, and .525 is the league TS%. The square root comes to 1.078.. .
So I boost his scoring rate by 7.8% (on top of all other adjustments). This raises his standardized per-36 rate from 18.5 to 19.9. With his other contributions raising his 'T-Rate' to 30.1, I guess his TS%-adjustment accounts for about 5% of that.
There is more to Offense than not-missing shots and not-creating turnovers. So it perplexes me when a researcher assumes a stat called 'offensive rating' actually refers to rating a player's Offense; and then goes to a lot of work trying to make something of it.
I'm getting the feeling there's a lot of 'deadwood' building up in our collective analyses. Are we creating 'better stats', or just 'more stats'?
_________________
`
36% of all statistics are wrong
Last edited by Mike G on Tue Jan 17, 2006 2:12 pm; edited 1 time in total
Back to top
View user's profile Send private message Send e-mail
RocketsFan
Joined: 23 Oct 2005
Posts: 404
PostPosted: Tue Jan 17, 2006 2:09 pm Post subject: Reply with quote
Mike, I think you're misunderstanding me. I wasn't stating that Schayes was better offensively than Ewing, but rather noting why he did better in the WARP calculations. And the 1999-2000 season was used as just an example of WARP's weaknesses, since the Iverson example was the most glaring flaw I found. I don't consider earlier seasons to accurately represent player quality.
I wasn't seeking the perfect basketball stat. I just did this for fun.
Back to top
View user's profile Send private message Yahoo Messenger
Mike G
Joined: 14 Jan 2005
Posts: 3584
Location: Hendersonville, NC
PostPosted: Tue Jan 17, 2006 2:19 pm Post subject: Reply with quote
And I'm not trying to take the fun out of anything. Just suggesting where you might be stumbling over something that's really no big deal. Anyone who enters into this fun world of stats might make a breakthrough, or see something obvious that no one else sees. Carry on.
_________________
`
36% of all statistics are wrong
Joined: 16 Jan 2008
Posts: 25
PostPosted: Thu Dec 24, 2009 12:23 pm Post subject: Lakers Offense and Defense Reply with quote
Kevin did a great job of looking at the Lakers' new identity as the best defensive team in the league on Monday: http://www.basketballprospectus.com/art ... icleid=831
That same morning, I touched on the same thing in Power Rankings. Today, for a Christmas preview, I looked at both sides of the ball during the course of Kobe Bryant's career.
In comparison to the league's average efficiency, this is both the worst offensive and best defensive team the Lakers have had in Bryant's career.
Offense
2009-10: +1.3
1996-97: +1.5
2004-05: +1.8
Defense:
2009-10: -7.4
1999-00: -5.6
2008-09: -3.6
Overall (Off. Diff - Def. Diff), this is the second best Lakers team of Bryant's career...
Overall:
1999-00: +9.0
2009-10: +8.7
1997-98: +8.5
I imagine the offense will improve by April, but it will be interesting to see if they can stay at the top defensively.
More tidbits on tomorrow's games: http://www.nba.com/2009/news/features/j ... index.html
The Celtics' rebounding fall-off is pretty interesting too.
_________________
John Schuhmann, NBA.com
Back to top
View user's profile Send private message
Serhat Ugur (hoopseng)
Joined: 13 Oct 2006
Posts: 209
Location: Basketball Research
PostPosted: Thu Dec 24, 2009 12:55 pm Post subject: Reply with quote
This season's SOS might have an influence on Lakers current success. It would better get factored in your analysis.
_________________
http://www.nbastuffer.com
Back to top
View user's profile Send private message Visit poster's website
back2newbelf
Joined: 21 Jun 2005
Posts: 274
PostPosted: Thu Dec 24, 2009 1:11 pm Post subject: Reply with quote
The Lakers' schedule will, on average, be about 3 points harder *per game* from now on, so I doubt they'll hold first place in DRTG for long.
I'm not really surprised by the C's rebounding. They shipped off their best rebounder and brought in one of the worst offensive rebounding big men in the league.
Back to top
View user's profile Send private message
deepak
Joined: 26 Apr 2006
Posts: 665
PostPosted: Thu Dec 24, 2009 1:30 pm Post subject: Reply with quote
A couple trends from last year that I think are relevant.
The Lakers defense started very strong and tapered off as the season progressed. This is a general trend for the league (as offenses tend to struggle early on), but the effect was particularly strong for last year's Lakers.
Notice also the difference in defense at home and on the road. Here were the home/road splits last year:
Code:
ORTG DRTG
Home 112.8 103.3
Road 112.9 107.1
This year, the home/road splits are:
Code:
ORTG DRTG
Home 109.9 99.7
Road 104.5 98.9
But they've only played 9 road games. Last year, after 7 road games they had a better DRTG on the road than at home too (that also was a home-heavy schedule early). That didn't last as the season progressed.
Back to top
View user's profile Send private message
Serhat Ugur (hoopseng)
Joined: 13 Oct 2006
Posts: 209
Location: Basketball Research
PostPosted: Fri Dec 25, 2009 2:04 am Post subject: Reply with quote
deepak_e wrote:
A couple trends from last year that I think are relevant.
Thanks for sharing the stuff. Very informative...
_________________
http://www.nbastuffer.com
Back to top
View user's profile Send private message Visit poster's website
johnschuhmann
Joined: 16 Jan 2008
Posts: 25
PostPosted: Sun Dec 27, 2009 10:26 am Post subject: Reply with quote
True about the SOS with respect to their defense. And good points by deepak_e.
At one point in December last year, when their defense starting falling off a bit, I asked Derek Fisher about it. Basically, the Lakers had tweaked their defense that season to be more like the Celtics, loading up on the strong side. But as the season went on, their opponents adjusted and looked to attack early and attack the middle of the floor.
And obviously, the addition of Artest is a factor this season. So I wonder if we'll see the same trend defensively.
But it's the offensive end that I find most fascinating. The SOS and road-heavy schedule the rest of the way would seemingly keep the offense down, but we also have to account for Gasol's absence for the first 11 games and Artest making the adjustment to the triangle.
Anyway, something to keep an eye on.
_________________
John Schuhmann, NBA.com
New topic
RocketsFan
Joined: 23 Oct 2005
Posts: 404
PostPosted: Fri Jan 13, 2006 7:20 pm Post subject: WARP Reply with quote
I've just finished doing my own WARP calculations for the 1987-88 season (I chose that year because it featured a lot of great players in their prime), and I was wondering where I might share the methodology. I didn't think this forum would be an appropriate place.
Back to top
View user's profile Send private message Yahoo Messenger
Mike G
Joined: 14 Jan 2005
Posts: 3584
Location: Hendersonville, NC
PostPosted: Fri Jan 13, 2006 7:25 pm Post subject: Reply with quote
You never know what will fly, in here. Go for it.
_________________
`
36% of all statistics are wrong
Back to top
View user's profile Send private message Send e-mail
Ed Küpfer
Joined: 30 Dec 2004
Posts: 785
Location: Toronto
PostPosted: Fri Jan 13, 2006 7:32 pm Post subject: Re: WARP Reply with quote
RocketsFan wrote:
I was wondering where I might share the methodology. I didn't think this forum would be an appropriate place.
This is precisely the appropriate place. Lets see what you got.
_________________
ed
Back to top
View user's profile Send private message Send e-mail
Kevin Pelton
Site Admin
Joined: 30 Dec 2004
Posts: 979
Location: Seattle
PostPosted: Fri Jan 13, 2006 10:46 pm Post subject: Reply with quote
Are you concerned about the length of the explanation? I'm sure we can figure something out if that's the case.
Back to top
View user's profile Send private message Send e-mail Visit poster's website
RocketsFan
Joined: 23 Oct 2005
Posts: 404
PostPosted: Fri Jan 13, 2006 10:49 pm Post subject: Reply with quote
You will need Dean Oliver's Basketball on Paper (BoP). If you don't have this book, buy it. Now.
Calculate Team Offensive and Defensive Possessions. The formulas can be found at basketball-reference.com or in BoP.
Calculate the League Rating (LgPtsPerPoss).
Calculate individual Defensive Rating.
Calculate Points Produced and Player Possessions from BoP.
Divide Team Defensive Possessions among players based on minutes played. That's (TmDPoss/TmMin)*Min. We'll call this Individual Defensive Possessions.
Calculate how many points a team with average players would score with this player at the player's team's pace. The reason for this is that you would have to adjust every player to a league average pace otherwise. The formula is (TmPoss-Poss)*(LgRtg/100)+PProd.
Divide by TmPoss to get the team ORtg.
Calculate points allowed with average players. This is (TmDPoss-DPoss)*LgRtg+DPoss*(DRtg/100).
Divide by TmDPoss to get the team DRtg.
Use the bell curve or pythagorean formula to calculate player winning percentage. I'm using the bell curve.
Wins are then 82*PWPct, and Losses are 82-Wins.
Okay, this is where it gets tricky. I set the replacement level at .200. I figured .300, which I think is what Baseball Prospectus uses for its WARP calculations, would be too high. The percentage of teams that finished below .200 in basketball is higher than those that finished below .300 in baseball. You can change the replacement level to whatever you please.
Calculate points scored if the player is replaced by a replacement player. This is (TmPoss-Poss)*(LgRtg/100)+Poss*(LgRtg/100)*.9505.
Divide by TmPoss to get Replacement ORtg.
Calculate points allowed with the replacement player. This is (TmDPoss-DPoss)*(LgRtg/100)+DPoss*(LgRtg/100)*1.0495.
I use the figures of .9505 and 1.0495, because 95.05^14/(95.05^14+104.95^14) = about .200.
Divide by TmDPoss to get Replacement DRtg.
Calculate replacement winning percentage using the bell curve or pythagorean formula.
Calculate replacement wins and losses.
WARP is Wins-Replacement Wins.
The Top 20 of 1987-88, Player, WARP.
1. Michael Jordan 21.24
2. Charles Barkley 14.65
3. Larry Bird 13.56
4. Clyde Drexler 11.69
5. John Stockton 11.48
6. Hakeem Olajuwon 8.93
7. Magic Johnson 8.74
8. Byron Scott 8.64
9. Kevin McHale 8.63
10. Fat Lever 8.01
11. Dominique Wilkins 7.95
12. Adrian Dantley 7.92
13. Karl Malone 7.84
14. Dale Ellis 7.52
15. Terry Porter 7.47
16. Mark Aguirre 7.43
17. Derek Harper 7.13
18. Jack Sikma 6.90
19. Danny Schayes 6.77
20. Danny Ainge 6.54
That's how I calculate WARP. Sorry about the messy list, but I'm not sure how to make it look more readable. If you have any questions, PM me or just post here.
Back to top
View user's profile Send private message Yahoo Messenger
Mike G
Joined: 14 Jan 2005
Posts: 3584
Location: Hendersonville, NC
PostPosted: Mon Jan 16, 2006 11:01 am Post subject: Reply with quote
I would think Patrick Ewing would have been more instrumental to wins-creation than about half of these players. In a career-low 31 mpg, he averaged 20-8, 3 blk; shot .594 TS%.
At first, I think maybe you're giving too much credit for minutes played. But Danny Schayes did less than Ewing, and he played fewer minutes.
_________________
`
36% of all statistics are wrong
Back to top
View user's profile Send private message Send e-mail
Kevin Pelton
Site Admin
Joined: 30 Dec 2004
Posts: 979
Location: Seattle
PostPosted: Mon Jan 16, 2006 1:48 pm Post subject: Reply with quote
Interesting. I use a very different method to calculate WARP (haven't gone back to 87-88, for Dougstats-related reasons), but still come up with very similar top-end numbers -- Garnett led the league last year with 21.1 WARP.
Back to top
View user's profile Send private message Send e-mail Visit poster's website
RocketsFan
Joined: 23 Oct 2005
Posts: 404
PostPosted: Mon Jan 16, 2006 8:41 pm Post subject: Reply with quote
I found an error in my calculations, so I thought I should update the list.
1. Michael Jordan 19.37
2. Charles Barkley 14.66
3. Larry Bird 12.93
4. John Stockton 12.70
5. Clyde Drexler 11.40
6. Magic Johnson 9.11
7. Hakeem Olajuwon 8.93
8. Kevin McHale 8.75
9. Byron Scott 8.71
10. Fat Lever 8.60
Mike, I think the reason Danny Schayes does so much better than Patrick Ewing is their offensive ratings. Schayes rating is 121.5, while Ewing's is only 108. League was 107.6. Ewing can't be expected to lead a team of average player's to a strong offensive improvement if he's barely above average offensively.
Still, I think the numbers rely too much on offensive and defensive ratings. The top twenty of the lists for the three seasons I've done look good, but it begins to break down after that. WARP has Allen Iverson as the 5th best player on the Sixers in 1999-2000, because his offensive rating was lower than his defensive rating. So much for passing the laugh test. The lesson here? There is no Holy Grail of player ratings.
Back to top
View user's profile Send private message Yahoo Messenger
bchaikin
Joined: 27 Jan 2005
Posts: 687
Location: cleveland, ohio
PostPosted: Mon Jan 16, 2006 10:02 pm Post subject: Reply with quote
The Top 20 of 1987-88, Player, WARP.
1. Michael Jordan 21.24
2. Charles Barkley 14.65
3. Larry Bird 13.56
4. Clyde Drexler 11.69
5. John Stockton 11.48
6. Hakeem Olajuwon 8.93
7. Magic Johnson 8.74
8. Byron Scott 8.64
9. Kevin McHale 8.63
10. Fat Lever 8.01
11. Dominique Wilkins 7.95
12. Adrian Dantley 7.92
13. Karl Malone 7.84
14. Dale Ellis 7.52
15. Terry Porter 7.47
16. Mark Aguirre 7.43
17. Derek Harper 7.13
18. Jack Sikma 6.90
19. Danny Schayes 6.77
20. Danny Ainge 6.54
simulation shows jordan's 87-88 season as the season that generated the most wins from the SG slot in the past 28 seasons (since the 77-78 season when turnovers were first kept). for comparison to the above list here's some wins generated for some SGs from that 87-88 season....
i took a bad team from that year that had poor SG play - the nj nets with SGs otis birdsong and dennis hopson - simulated those 2 SGs each for 40 min/g, then replaced them for 40 min/g with other SGs from around the league (no other changes to the nets sub pattern) in 87-88 to see the difference in wins generated. below are the results:
wins---player replacing birdsong/hopson for 40 min/g at SG on the nets
45----- michael jordan (chi)
44
43
42
41
40
39
38.5--- clyde drexler (por)
38
37
36
35.5--- fat lever (den),
35
34
33.5--- byron scott (lal),
33
32.5---- alvin robertson (san),
32
31.5--- dale ellis (sea),
31----- t.r. dunn (den),
30----- sidney moncrief (mil), rolando blackman (dal),
29
28.5--- danny ainge (bos), reggie miller (ind),
28------ ron harper (cle), bob hansen (uta),
27.5---- craig ehlo (cle), dudley bradley (njn),
27------ joe dumars (det),
26----- john long (ind), ricky pierce (mil),
25.5--- jeff hornacek (pho), del curry (cle), trent tucker (nyk),
25----- quintin dailey (lac), kevin williams (sea),
24.5---- randy wittman (atl), craig hodges (mil), derek smith (sac),
24------ jeff malone (was),
23.5---- gerald wilkins (nyk), mike woodson (lac),
23------ reggie theus (sac),
22.5---- vinnie johnson (det), terry teagle (gsw), darrell griffith (uta),
22
21----- dennis hopson (njn),
20
19.5--- otis birdsong (njn), world free (hou),
19
so for example a slight difference compared to your WARP calculations simulation shows the difference between jordan and drexler as being 6-7 wins as opposed to 9-10, and say ellis and lever being 4 wins versus 0-1...
also on a 40 min/g basis for most seasons simulation typically shows the difference between the best and worst players at a specific position in terms of wins generated as being upwards of 15-17 wins, perhaps slightly more. this 87-88 season shows jordan 23-25 wins above, showing just how truly great his season was statistically...
Back to top
View user's profile Send private message Send e-mail Visit poster's website
Mike G
Joined: 14 Jan 2005
Posts: 3584
Location: Hendersonville, NC
PostPosted: Tue Jan 17, 2006 1:00 pm Post subject: Reply with quote
RocketsFan wrote:
... the reason Danny Schayes does so much better than Patrick Ewing is their offensive ratings. ...
Still, I think the numbers rely too much on offensive and defensive ratings. The top twenty of the lists for the three seasons I've done look good, but it begins to break down after that. WARP has Allen Iverson as the 5th best player on the Sixers in 1999-2000, because his offensive rating was lower than his defensive rating. So much for passing the laugh test...
Well, laughter is good for health. But maybe you are just young enough to 'know better' than to believe your results as of 2000; yet you trust them for bygone eras. The fact is, Danny didn't do anything better than Patrick.
'Offensive Rating' may be good for something, but I don't see how the term hopes to capture 'offense'. In 1988, among the top 10 in this stat, we find offensive wizards like Levingston, Sichting, and Leon Wood (along with Schayes, Jr.)
In 1989, you'll see the standard of offensive excellence was embodied by Rod Higgins, Trent Tucker, Brian Rowsom. (Sidney Lowe didn't have enough minutes to qualify). In 1990, Craig Hodges and Ed Nealy were what Jordan and Malone could only hope to be.
Last year, in this 'stat', Fred Hoiberg led all players of all time; he easily outpaced runners-up Greg Buckner and Anthony Goldwire. What does it mean to have a stat in which the 'best' exemplars are marginal players, often near the ends of their careers?
_________________
`
36% of all statistics are wrong
Back to top
View user's profile Send private message Send e-mail
jkubatko
Joined: 05 Jan 2005
Posts: 702
Location: Columbus, OH
PostPosted: Tue Jan 17, 2006 1:15 pm Post subject: Reply with quote
Mike G wrote:
Last year, in this 'stat', Fred Hoiberg led all players of all time; he easily outpaced runners-up Greg Buckner and Anthony Goldwire. What does it mean to have a stat in which the 'best' exemplars are marginal players, often near the ends of their careers?
Mike, as usual, I'm not sure if you're trying to be clever or not. Offensive ratings for individual players estimate points produced per 100 possessions used. The guys with the top offensive ratings aren't necessarily the best offensive players in the league. Last year, Fred Hoiberg and Greg Buckner were second and third, respectively, in true shooting percentage. Should we throw that out as well? If so, we might as well ingore your "T-Rates," since you make an adjustment for true shooting percentage in your calculations.
_________________
Regards,
Justin Kubatko
Basketball-Reference.com
Back to top
View user's profile Send private message Send e-mail Visit poster's website
94by50
Joined: 01 Jan 2006
Posts: 499
Location: Phoenix
PostPosted: Tue Jan 17, 2006 2:07 pm Post subject: Reply with quote
Plus, that doesn't take into account possessions used. Sure, Hoiberg might have had a 138 rating, but he only used an estimated 290 possessions on the entire season. This was ninth on his own team, and less than 20% of the league's leaders (the top 10 all had at least roughly 1600 possessions).
Last edited by 94by50 on Tue Jan 17, 2006 2:11 pm; edited 1 time in total
Back to top
View user's profile Send private message
Mike G
Joined: 14 Jan 2005
Posts: 3584
Location: Hendersonville, NC
PostPosted: Tue Jan 17, 2006 2:08 pm Post subject: Reply with quote
I'd suggest we not call this 'offensive rating' but rather 'not wasting possessions' or some such thing. Even then, players who seem to do so little in so many minutes may be responsible for uncounted things like team turnovers. Just assigning them their share in proportion to their minutes would impact their rating significantly -- relative to their meager contributions.
Yeah, I have a tendency to try to get some good out of it; even if only a laugh.
Richard Jefferson has about the best TS% in the league, among the better scorers. I multiply his scoring rate by (.610/.525)^.5; where .610 is RJ's TS%, and .525 is the league TS%. The square root comes to 1.078.. .
So I boost his scoring rate by 7.8% (on top of all other adjustments). This raises his standardized per-36 rate from 18.5 to 19.9. With his other contributions raising his 'T-Rate' to 30.1, I guess his TS%-adjustment accounts for about 5% of that.
There is more to Offense than not-missing shots and not-creating turnovers. So it perplexes me when a researcher assumes a stat called 'offensive rating' actually refers to rating a player's Offense; and then goes to a lot of work trying to make something of it.
I'm getting the feeling there's a lot of 'deadwood' building up in our collective analyses. Are we creating 'better stats', or just 'more stats'?
_________________
`
36% of all statistics are wrong
Last edited by Mike G on Tue Jan 17, 2006 2:12 pm; edited 1 time in total
Back to top
View user's profile Send private message Send e-mail
RocketsFan
Joined: 23 Oct 2005
Posts: 404
PostPosted: Tue Jan 17, 2006 2:09 pm Post subject: Reply with quote
Mike, I think you're misunderstanding me. I wasn't stating that Schayes was better offensively than Ewing, but rather noting why he did better in the WARP calculations. And the 1999-2000 season was used as just an example of WARP's weaknesses, since the Iverson example was the most glaring flaw I found. I don't consider earlier seasons to accurately represent player quality.
I wasn't seeking the perfect basketball stat. I just did this for fun.
Back to top
View user's profile Send private message Yahoo Messenger
Mike G
Joined: 14 Jan 2005
Posts: 3584
Location: Hendersonville, NC
PostPosted: Tue Jan 17, 2006 2:19 pm Post subject: Reply with quote
And I'm not trying to take the fun out of anything. Just suggesting where you might be stumbling over something that's really no big deal. Anyone who enters into this fun world of stats might make a breakthrough, or see something obvious that no one else sees. Carry on.
_________________
`
36% of all statistics are wrong
Last edited by Crow on Wed May 25, 2011 12:25 am, edited 1 time in total.
Re: Recovered old threads- miscellaneous topics
I have a question regarding those threads, am I the only who can't search through them?
No matter which word(s) I've tried I got an information:
No matter which word(s) I've tried I got an information:
Well, if all words are too common, what's the point of the search? Does anybody know what's going on? Thanks in advance.The following words in your search query were ignored because they are too common words: [...]. You must specify at least one word to search for. Each word must consist of at least 3 characters and must not contain more than 14 characters excluding wildcards.
regards,
wiLQ @ http://weaksideawareness.wordpress.com
wiLQ @ http://weaksideawareness.wordpress.com