Can anyone point me to any data on predictive aging curves for NBA players? Sorry if this has been asked before, but I'm getting no love from the search engine.
Thanks!
Aging curves
Re: Aging curves
A repost from the old forum:
Here is some rough work on WS/48 aging curves.
I followed the procedure outlined here: http://www.insidethebook.com/ee/index.p ... 1957_2006/
Obviously, survivor bias is a huge issue, and one I don't fully know how to compensate for.
I used matched pairs of all players that had 100 MPG in both years. The fact that a player had 100 MPG in each year biases the older sample towards decline, since in order for a player to get 100 MPG in Y+1 he had to perform to a certain level in Y, perhaps even be lucky. The same is true in early years, biasing towards increase, though not so badly.
To try to solve this, I regressed the first year results, using the 200 minutes of expected WS/48, and compared that to the unadjusted second year results.
Here is the aging curve, showing raw WS/48 and the regressed WS/48. I'm not sure if I regressed the right way....
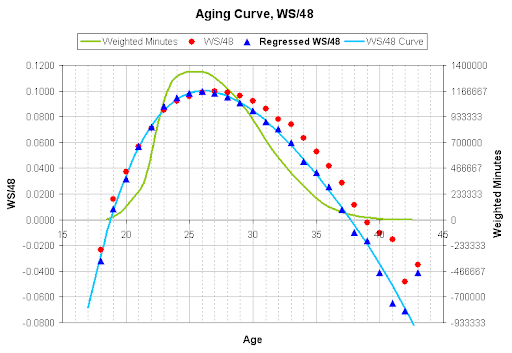
I'm showing the peak is at 26, rather than 27. That said, I like the looks of the regressed curve, particularly when compared to the minutes we see at each age. If the number of minutes starts to drop significantly at age 27, the players are probably passing their peak. I do expect the minutes to peak earlier than the players themselves, as players in development are given more minutes because of potential improvement.
Note I normalized these curves so the peaks would be at 0.100. In other words: if a player is at a true talent of 0.175 at age 25, he would be projected to be at 0.161 at age 30.
Here are the actual numbers, both for the Raw WS/48 and the Adjusted WS/48:
I recommend using the "curve" numbers; the curve is a 4th-order polynomial, fitted to the Regressed data, weighted the square root of the Effective Minutes (which aren't actual minutes played).
The equation of the curve:
Please evaluate whether I have regressed appropriately.... this survivor bias issue is difficult.
Here is some rough work on WS/48 aging curves.
I followed the procedure outlined here: http://www.insidethebook.com/ee/index.p ... 1957_2006/
Obviously, survivor bias is a huge issue, and one I don't fully know how to compensate for.
I used matched pairs of all players that had 100 MPG in both years. The fact that a player had 100 MPG in each year biases the older sample towards decline, since in order for a player to get 100 MPG in Y+1 he had to perform to a certain level in Y, perhaps even be lucky. The same is true in early years, biasing towards increase, though not so badly.
To try to solve this, I regressed the first year results, using the 200 minutes of expected WS/48, and compared that to the unadjusted second year results.
Here is the aging curve, showing raw WS/48 and the regressed WS/48. I'm not sure if I regressed the right way....
I'm showing the peak is at 26, rather than 27. That said, I like the looks of the regressed curve, particularly when compared to the minutes we see at each age. If the number of minutes starts to drop significantly at age 27, the players are probably passing their peak. I do expect the minutes to peak earlier than the players themselves, as players in development are given more minutes because of potential improvement.
Note I normalized these curves so the peaks would be at 0.100. In other words: if a player is at a true talent of 0.175 at age 25, he would be projected to be at 0.161 at age 30.
Here are the actual numbers, both for the Raw WS/48 and the Adjusted WS/48:
Code: Select all
Age    Eff. Min   Raw     Regressed   Curve
18     2648      -0.024    -0.032    -0.028
19     34629      0.016     0.008     0.006
20     126201     0.037     0.032     0.034
21     277620     0.057     0.057     0.056
22     624441     0.071     0.072     0.073
23     1055516    0.085     0.088     0.085
24     1279689    0.092     0.094     0.093
25     1334885    0.096     0.098     0.098
26     1332637    0.099     0.100     0.100
27     1284283    0.100     0.098     0.099
28     1186896    0.099     0.095     0.096
29     1062218    0.096     0.091     0.091
30     905080     0.092     0.085     0.085
31     729743     0.086     0.076     0.077
32     567531     0.078     0.070     0.067
33     429684     0.074     0.060     0.057
34     308454     0.063     0.045     0.046
35     201169     0.053     0.037     0.035
36     123215     0.042     0.025     0.022
37     71096      0.029     0.008     0.009
38     38210      0.011    -0.010    -0.005
39     20366     -0.002    -0.016    -0.019
40     8667      -0.010    -0.041    -0.035
41     3240      -0.015    -0.065    -0.051
42     1077      -0.048    -0.071    -0.069
43     296       -0.035    -0.041    -0.088
I recommend using the "curve" numbers; the curve is a 4th-order polynomial, fitted to the Regressed data, weighted the square root of the Effective Minutes (which aren't actual minutes played).
The equation of the curve:
Code: Select all
-2.7188227611   Intercept
 0.3199248445   Age
-0.0132504155   Age^2
 0.0002404433   Age^3
-0.0000016798 Age^4Re: Aging curves
And another repost:
Advanced Statistical Plus/Minus 2010-2011 Projections
Ever since I posted the historical ASPM numbers over on the development thread, I knew I had to try my hand at creating a projection system.
The basic idea: use a Marcel-type system, with a few additions.
I created a Bayesian Prior (instead of regressing to league mean), based on the team's efficiency differential and the player's (regressed) MPG. I use the last 5 team-season instances for the projections. There is a basic weight reduction factor for years ago, and also a weight reduction factor for changing teams.
First, I created the regressed Bayesian Prior, based on the information mentioned and a modified aging curve. The weight for this varies, but usually is in the area of 300 minutes (depending on games played, MPG, etc.). There is also a league-wide regression to a fixed number (near replacement level), weighted at about 120 minutes (the weights were found with Solver). Finally, the player's actual ASPM history is weighted based on minutes, team change, and years ago, and modified by the aging curve.
Here is the ASPM aging curve:
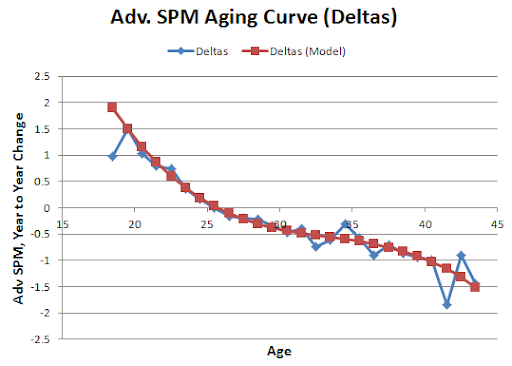
The model is a cubic, and the points were weighted by number of observations. The deltas themselves are Regressed Y compared with Y+1 and Regressed Y+1 compared with Y, for all instances where the player had a minimum of 100 Minutes in both seasons. So there could be some selection bias--the regressing should help some, though.
Advanced Statistical Plus/Minus 2010-2011 Projections
Ever since I posted the historical ASPM numbers over on the development thread, I knew I had to try my hand at creating a projection system.
The basic idea: use a Marcel-type system, with a few additions.
I created a Bayesian Prior (instead of regressing to league mean), based on the team's efficiency differential and the player's (regressed) MPG. I use the last 5 team-season instances for the projections. There is a basic weight reduction factor for years ago, and also a weight reduction factor for changing teams.
First, I created the regressed Bayesian Prior, based on the information mentioned and a modified aging curve. The weight for this varies, but usually is in the area of 300 minutes (depending on games played, MPG, etc.). There is also a league-wide regression to a fixed number (near replacement level), weighted at about 120 minutes (the weights were found with Solver). Finally, the player's actual ASPM history is weighted based on minutes, team change, and years ago, and modified by the aging curve.
Here is the ASPM aging curve:
The model is a cubic, and the points were weighted by number of observations. The deltas themselves are Regressed Y compared with Y+1 and Regressed Y+1 compared with Y, for all instances where the player had a minimum of 100 Minutes in both seasons. So there could be some selection bias--the regressing should help some, though.
Re: Aging curves
For the survivor bias issue, it might help to classify players into groups according to age of exit from the league. Look at all players who played until age 25, 26, etc. See what the trends are like within those groups and between groups.
Re: Aging curves
There are 2 aging threads that were re-posted (see pages 4 and 6), including one from DSMok1 with this same cited data, but apparently the graphs did not carryover for some reason. I hadn't noticed that til now.
Re: Aging curves
Daniel,DSMok1 wrote: Here is the ASPM aging curve:
The curve isn't showing up (at least not on my system); could you please re-post? Thanks! - Steve
Re: Aging curves
I can see the image. Here's a direct link to it on Picasa:
https://picasaweb.google.com/1183961692 ... 7883209074
https://picasaweb.google.com/1183961692 ... 7883209074
-
Jeff Fogle
- Posts: 95
- Joined: Fri Apr 15, 2011 2:05 am
Re: Aging curves
I remember it being discussed, but can't remember all the details. Were studies done focusing on what we could call "mileage" rather than calendar age. By that I mean....charting production based on career minutes. Seems like somebody asked if players who started younger were ending younger. Can't remember if there was a study linked to minute mileage...with cut-off's at 3,000, 6,000, etc... rather than calendar ages...
Blogging basketball at http://www.statintelligence.blogspot.com/
Re: Aging curves
Yes, on average, players of a given ability who enter the NBA younger are likely to end their career with no more years or minutes than players of equal ability who enter later.
But, since the same player doesn't enter at 19 and at 22, and we are looking at different personalities as well as similar abilities, we can't really say how one's career might have gone. Marbury, Antoine Walker, and other such players may not have been productive in college or elsewhere, at age 19-21. While the pros didn't straighten out their priorities, there's not evidence that college would have done so.
But, since the same player doesn't enter at 19 and at 22, and we are looking at different personalities as well as similar abilities, we can't really say how one's career might have gone. Marbury, Antoine Walker, and other such players may not have been productive in college or elsewhere, at age 19-21. While the pros didn't straighten out their priorities, there's not evidence that college would have done so.
-
Jeff Fogle
- Posts: 95
- Joined: Fri Apr 15, 2011 2:05 am
Re: Aging curves
Got timed out after typing for just a few minutes. Will make it briefer.
Mike, do you think it's better to think of aging as a "mileage" curve rather than a "calendar age" curve? Or, do 19-year olds keep rising up to the normal peak and plateau at the traditional age...then the "mileage" isn't an issue until they reach xxx number of minutes?
Does the aging curve have a pretty universal peak regardless of when you join the league? But, then a mileage wall takes you out at the end? Or, do young players follow a mileage curve that's 2-3 years ahead of the normal pace all the way through (peaking earlier, ending earlier than past standards)?
Blogging basketball at http://www.statintelligence.blogspot.com/
Re: Aging curves
I think it should be considered that there may be a significant selection effect. There's a reason usually why players come out at 19 (or 18 in past years) vs. 21+. It is possible that the younger (and more talented) players improve more, because the ability to improve (or the magnitude of improvement) is one of the characteristic features of "talent".