Mine has evolved over the years and this is how it now looks.
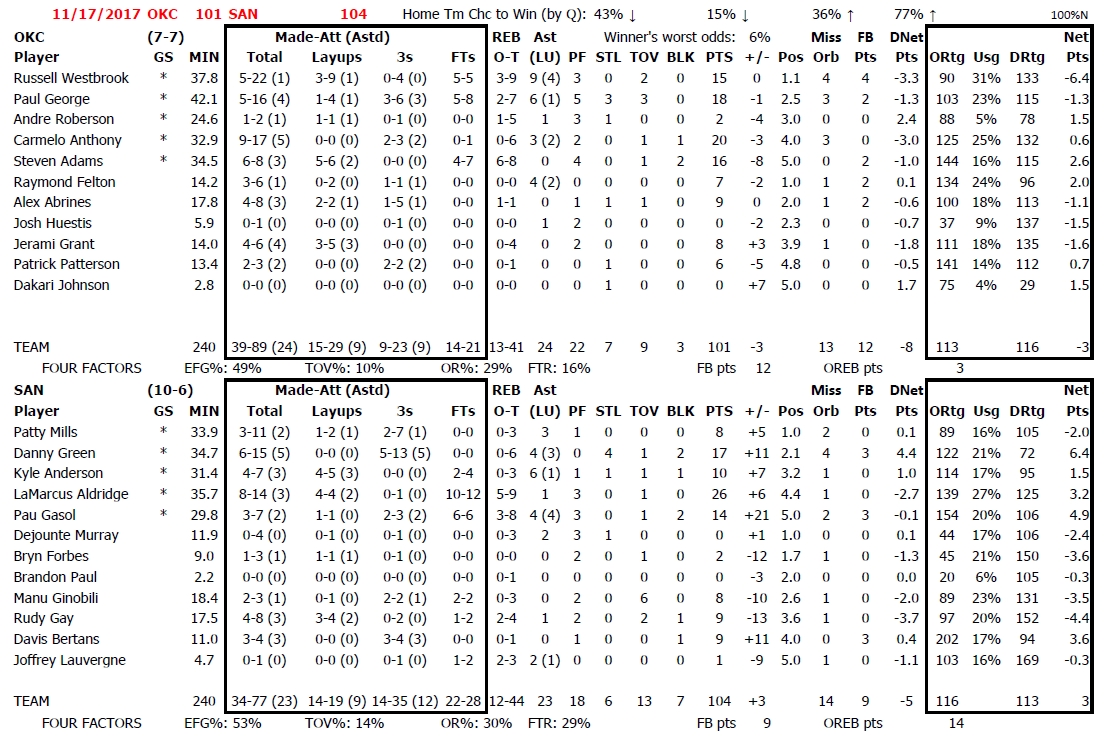
At the top is the final score, as well as a win probability version of the line score - showing the home team's average chance to win by quarter. You can see how San Antonio came back very well in this game. The far right number at the top indicates that 100% of the game was in "Normal" time. There no garbage time here.
I've extended the shot information to have layups, as well as the number of shots that were assisted.
Assists include number of assists for layups, which tend to be higher value.
Pos -- that is the average position the player played in the game. So Paul George went between the 2 and the 3 a lot, it appears.
Miss Orb -- that is the number of missed shots a player had that were rebounded by his team (as team or individual rebounds). It tends to be an indicator of how much help they draw, though definitely imperfect.
FB Pts is incredibly not in traditional boxscores and it is definitely important. The NBA does it officially but there are variations on what is transition vs not. I use their official number.
DNet Pts - is how many points a player adds through their defense. I've done a lot of play-level division of credit and that goes into this number. Danny Green had a good defensive game here.
The right section has individual offensive efficiency, defensive efficiency, possession usage, and the total net points a player added to the game. The old estimates of Basketball on Paper have been replaced by much more accurate estimates that add up (as long as the official data is correct, which it isn't sometimes).
The Four Factors are underneath each team's players - not an ideal placement because it doesn't stand out, but it's useful.
I put this out there to request feedback. Given the constraints of space, which I would like to stick to, are there things you would get rid of and replace with other things? I've always felt like it doesn't have enough defense, which is why I have the DNet Pts field, but it doesn't explain a lot of why.